Figure 6. Quantitative reverse-transcription PCR (qRT-PCR) analysis of related genes in response to YC-1 under chemical hypoxia. 661W
cells were incubated with 0.066% DMSO, 20 μM YC-1, 200 μM CoCl2, or both YC-1 and CoCl2 for 2 h or 24 h. After mRNA was extracted and reverse transcription was performed, relative HIF-1α (A), VEGF (B), glucose transporter 1 (GLUT1; C), carbonic anhydrase 9 (Car9; D), NF-κB (E), p53 (F), Bax (G), Bcl2 (H), Apaf1 (I), and cyclin-dependent kinase inhibitor 1A (p21; J) mRNAs were measured and compared to β-actin mRNA with qRT-PCR (n=3). * Indicates p<0.05 compared to the control group or the DMSO vehicle group; # indicates p<0.05 compared
to the chemically induced hypoxic group; + indicates p<0.05 compared to the YC-1-treated group. D, DMSO; Y, YC-1; C, CoCl2; Y+C, both YC-1 and CoCl2.
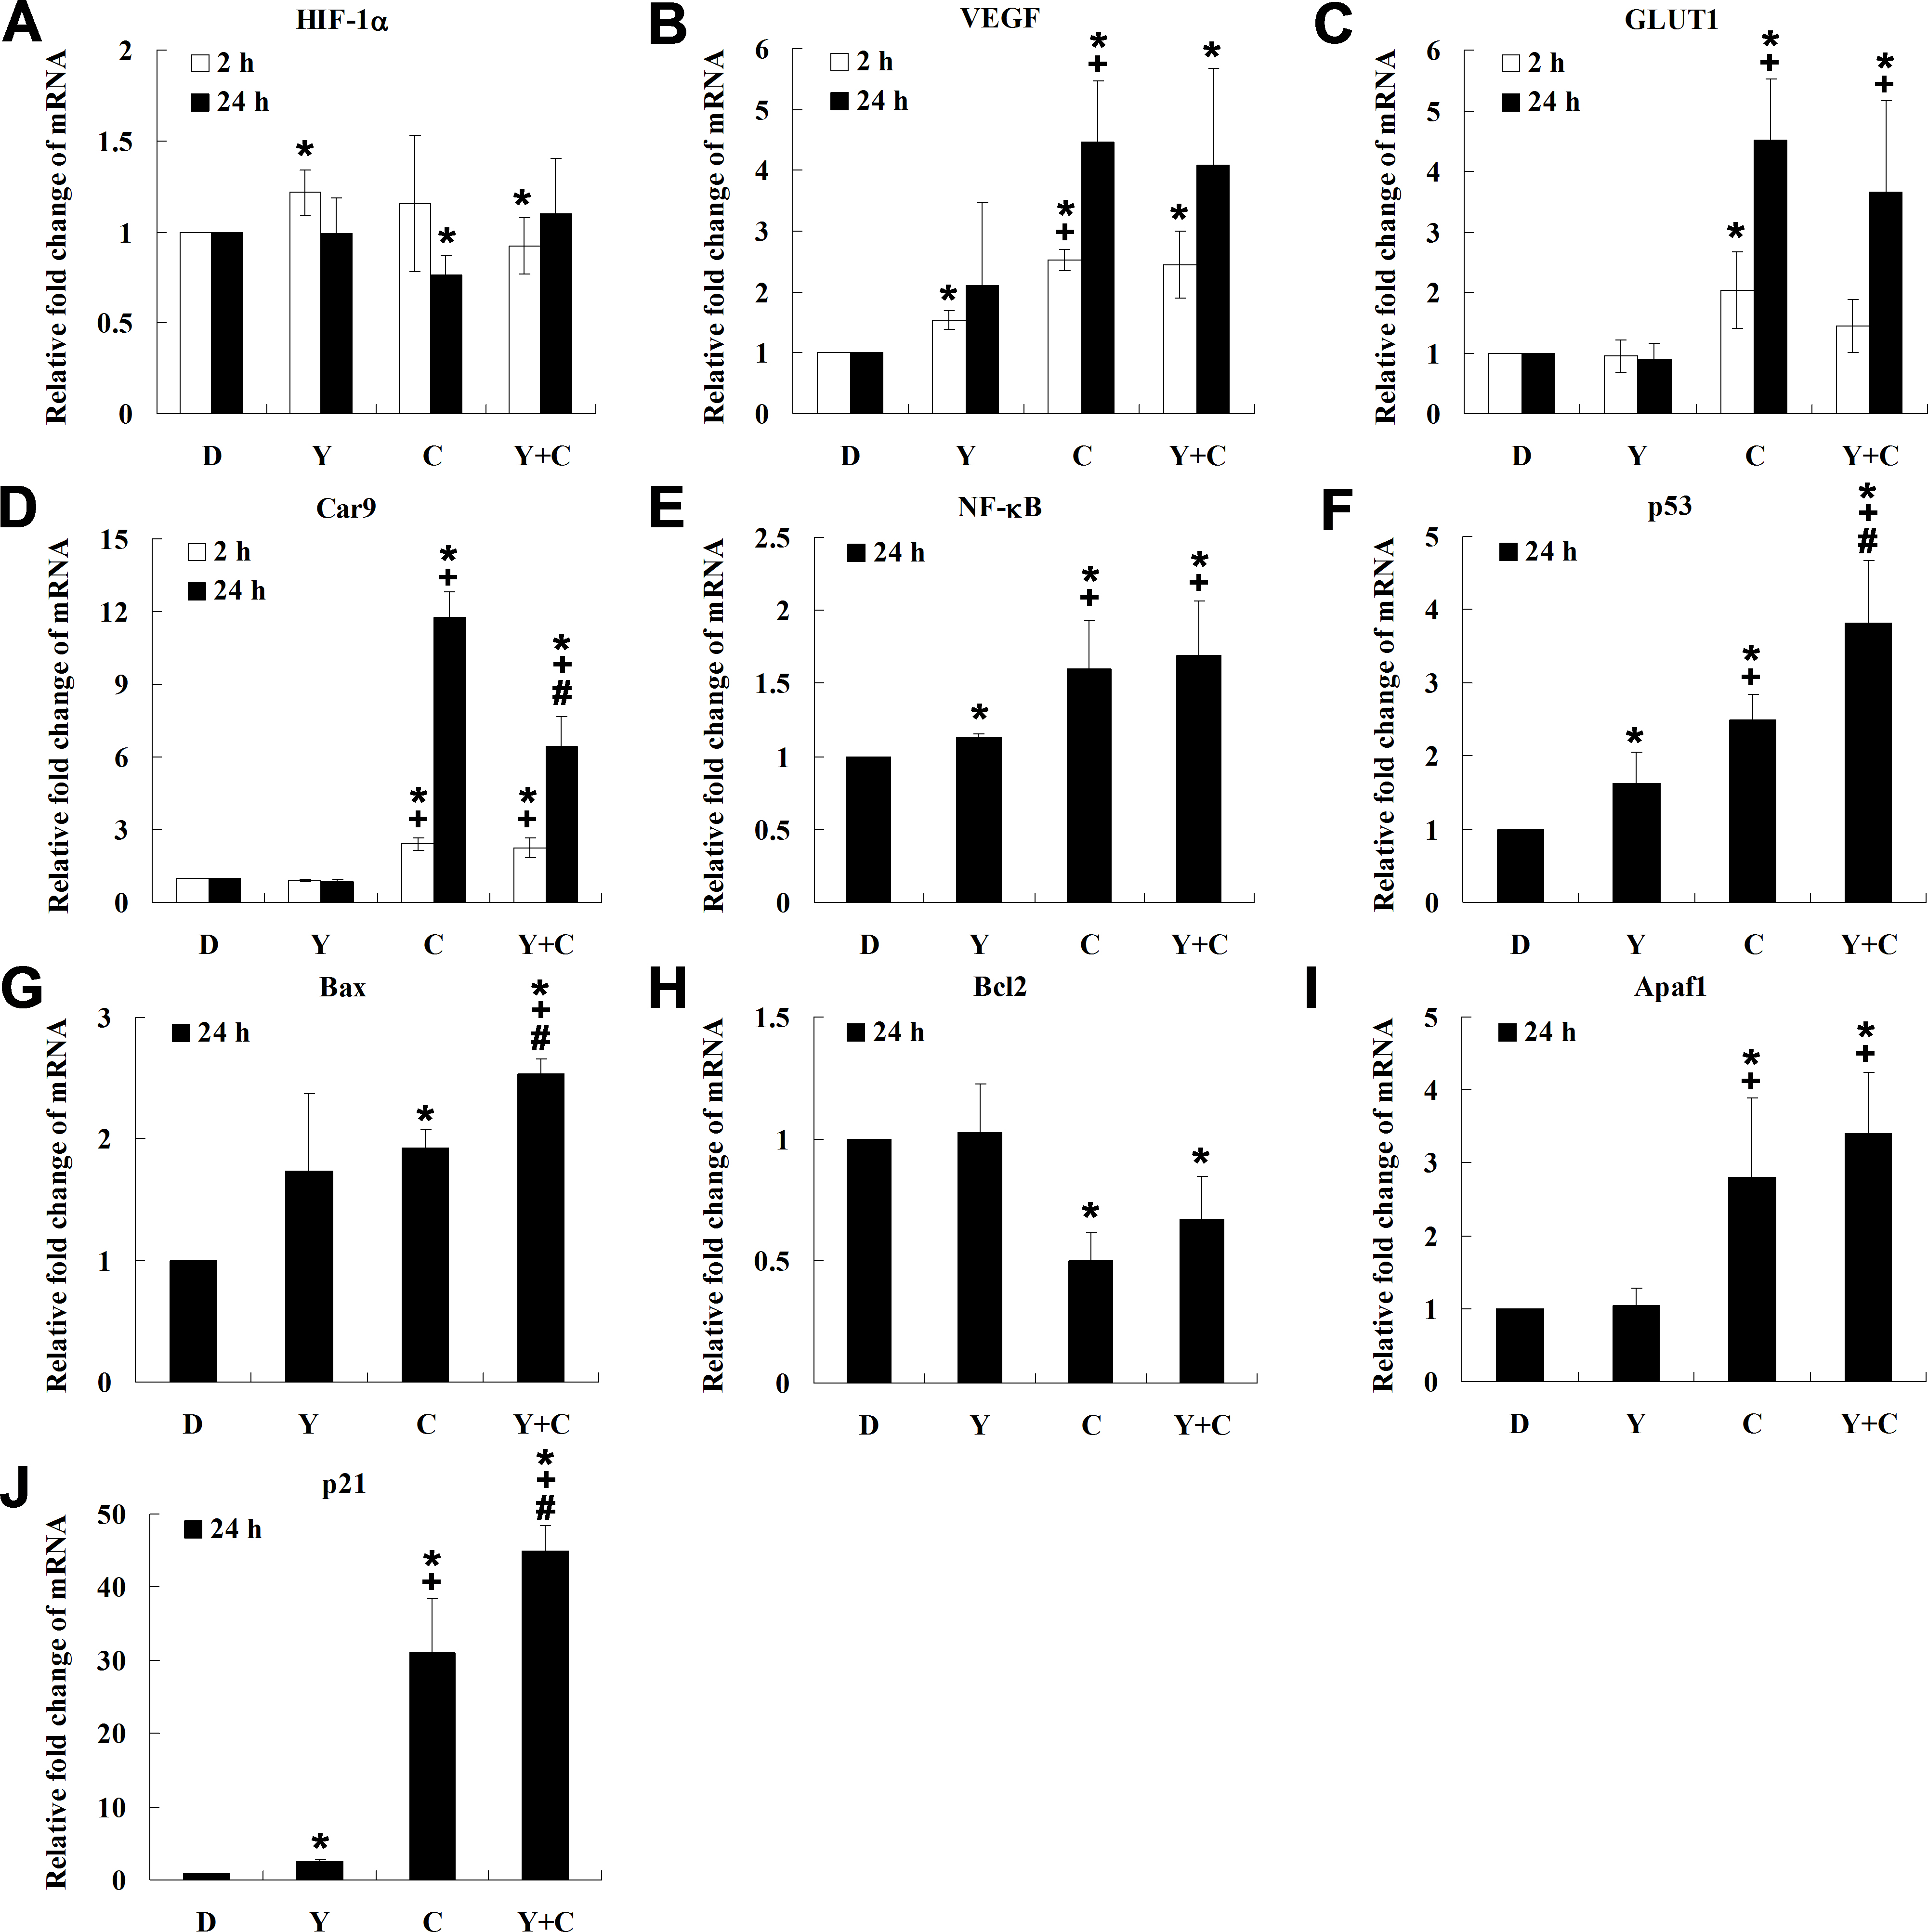
 Figure 6 of
Tsui, Mol Vis 2013; 19:2260-2273.
Figure 6 of
Tsui, Mol Vis 2013; 19:2260-2273.