Figure 3. High-content screening (HCS) of YC-1-treated cells under chemical hypoxia. 661W cells were exposed to 0.066% DMSO, 20 μM YC-1,
200 μM CoCl2, or both YC-1 and CoCl2 for 24 h. After fixation and immunofluorescence staining, cells were detected and analyzed using a Cellomics ArrayScan VTI
HCS Reader. A: Representative fluorescent photographs show the distribution of Ki-67 (green) and Hoechst-labeled nuclei (blue) using the Columbus Image Data Storage and Analysis System. Panels (B) and (C) show quantified HCS results for the number and ratio of Ki-67-stained nuclei (n=4). * Indicates p<0.05 compared to the control group or the DMSO vehicle group; # indicates p<0.05 compared
to the chemically induced hypoxic group.
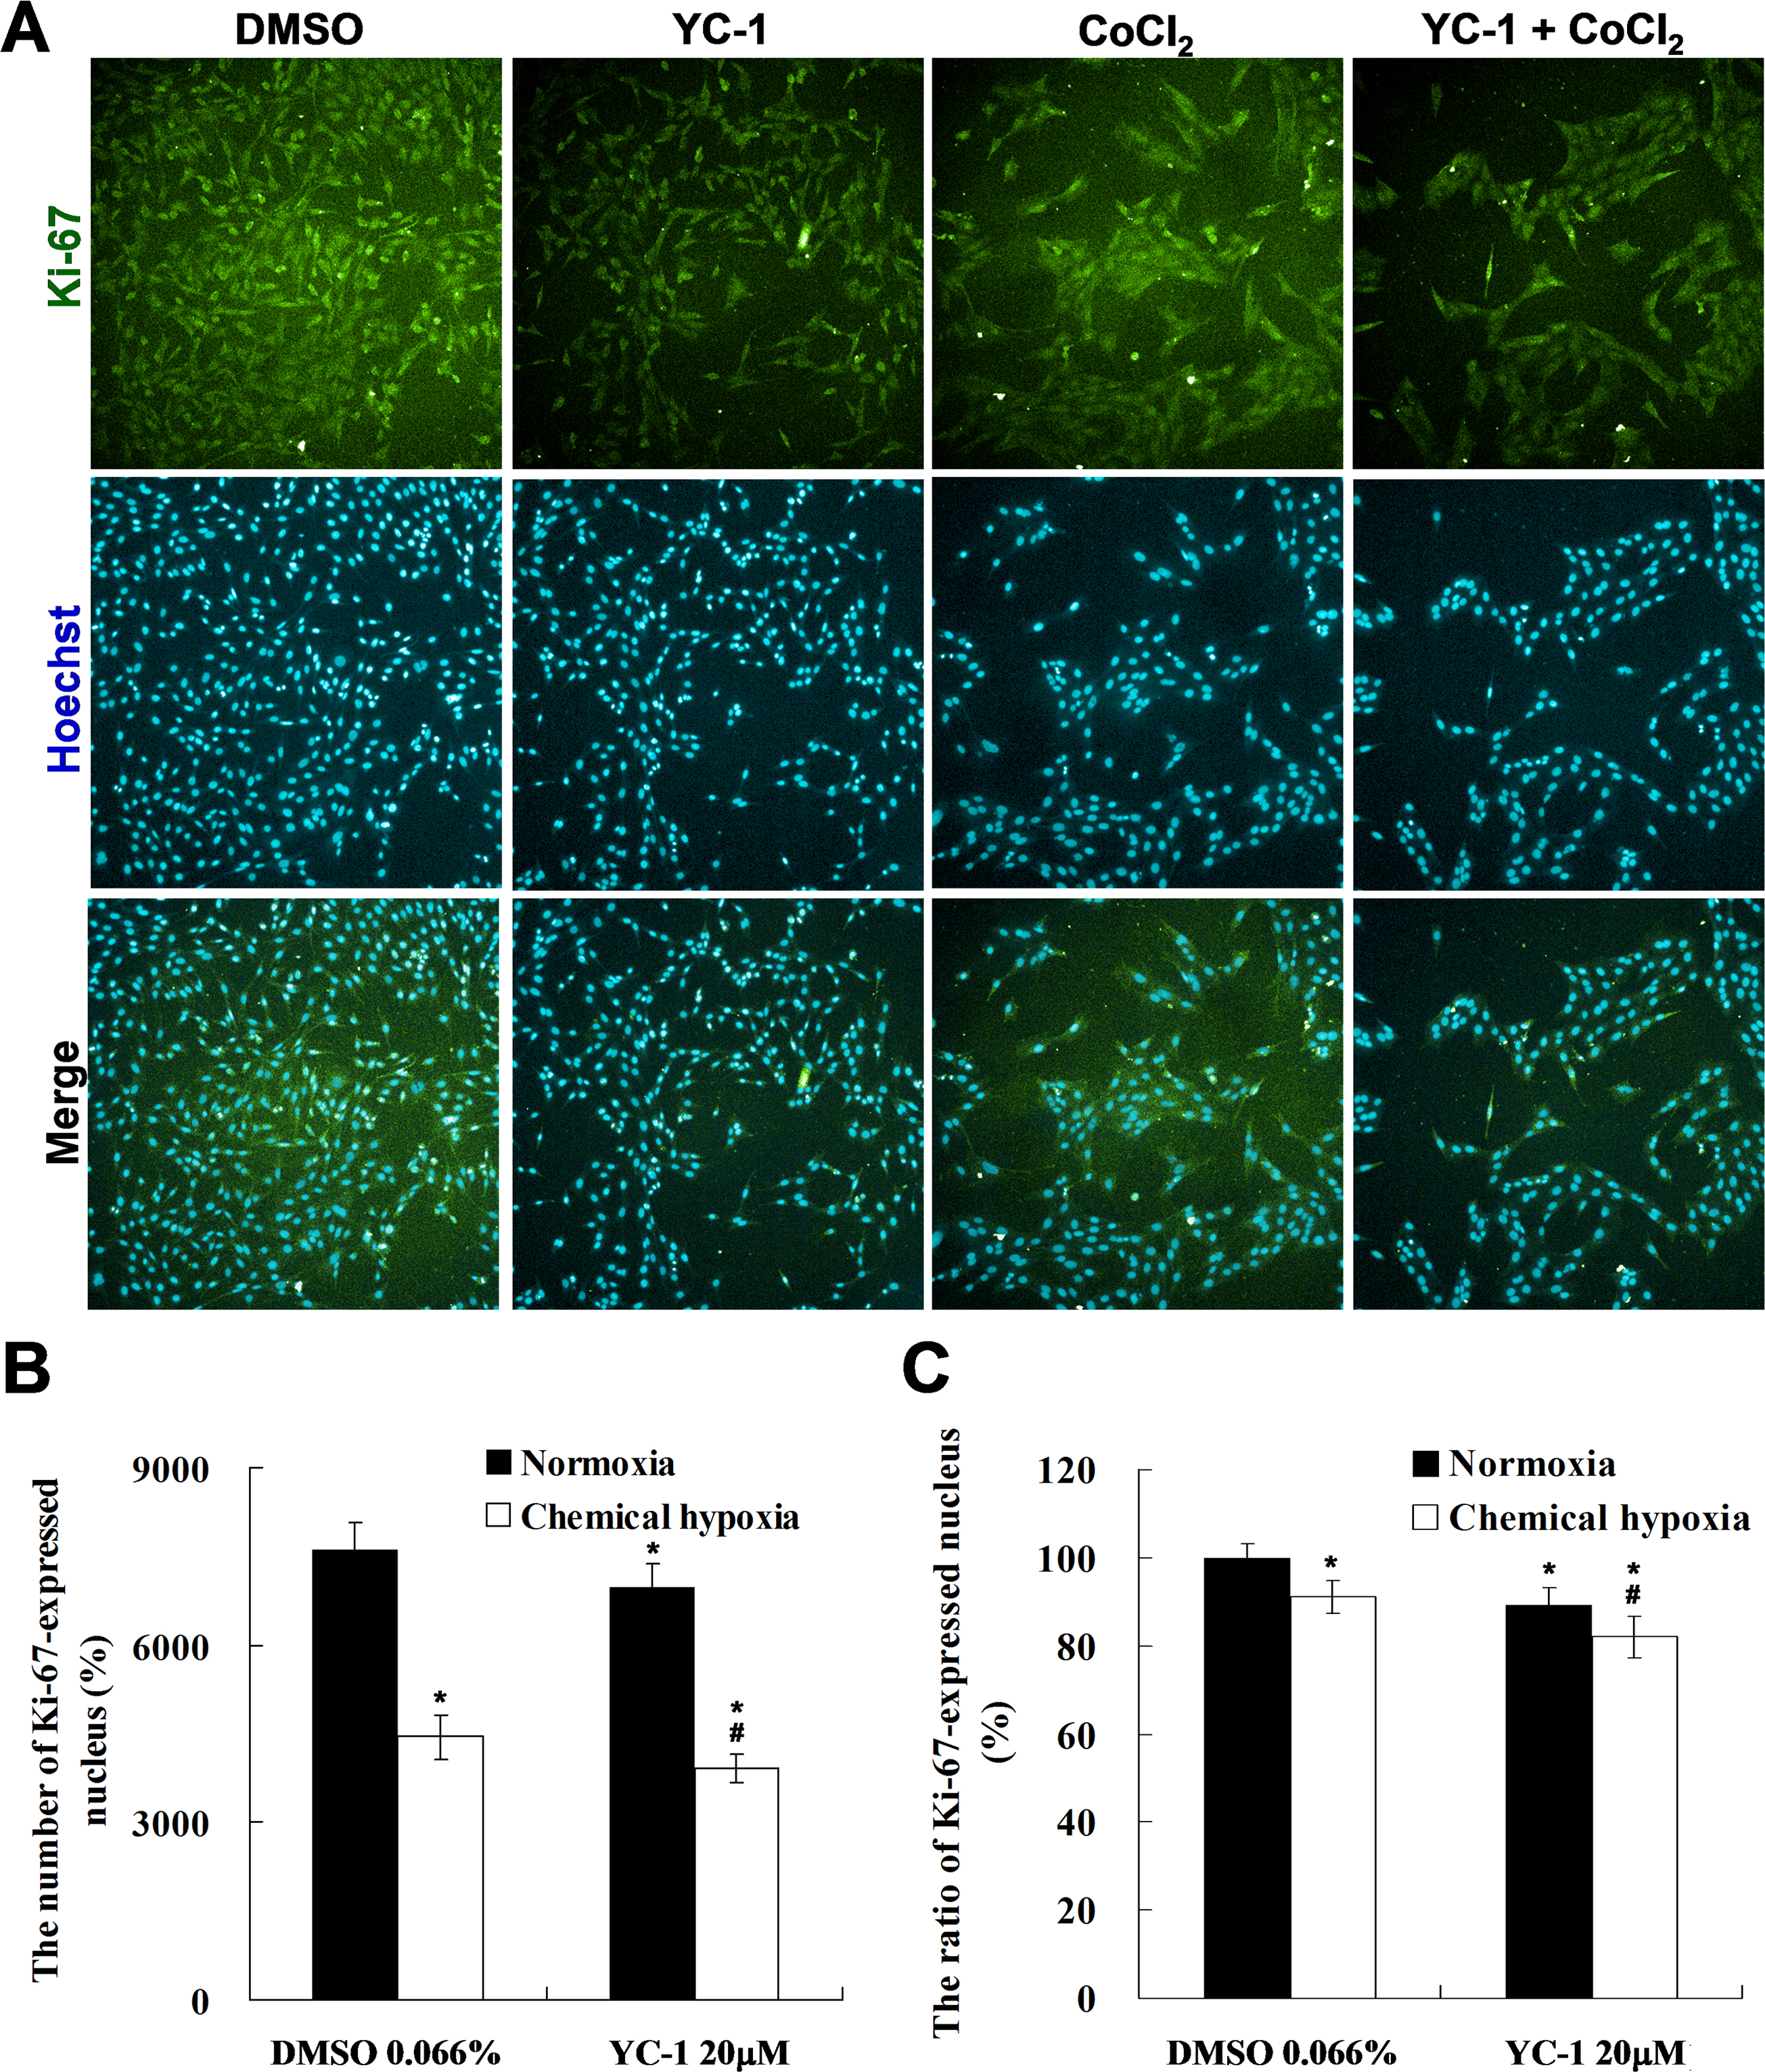
 Figure 3 of
Tsui, Mol Vis 2013; 19:2260-2273.
Figure 3 of
Tsui, Mol Vis 2013; 19:2260-2273.