Figure 2. LIVE/DEAD cell viability assay of YC-1-treated cells under chemical hypoxia. A: After treatment with 200 μM CoCl2 in the absence or presence of 20 μM YC-1 for 24 h, 661W cells were stained with calcein AM (green for live cells), EthD-1
(red for dead cells), and Hoechst 33,342 (blue for nuclei). Representative fluorescence staining shows the cell density and
composition. B: 661W cells were exposed to 0.066% DMSO, 20 μM YC-1, 200 μM CoCl2, or both YC-1 and CoCl2 for 24 h. After fluorescence staining, cells was measured and analyzed with flow cytometry. C: Quantitative data of flow cytometric analysis are from three independent experiments (n=3). * Indicates p<0.05 compared
to the control group or DMSO vehicle group; # indicates p<0.05 compared to the chemically induced hypoxic group.
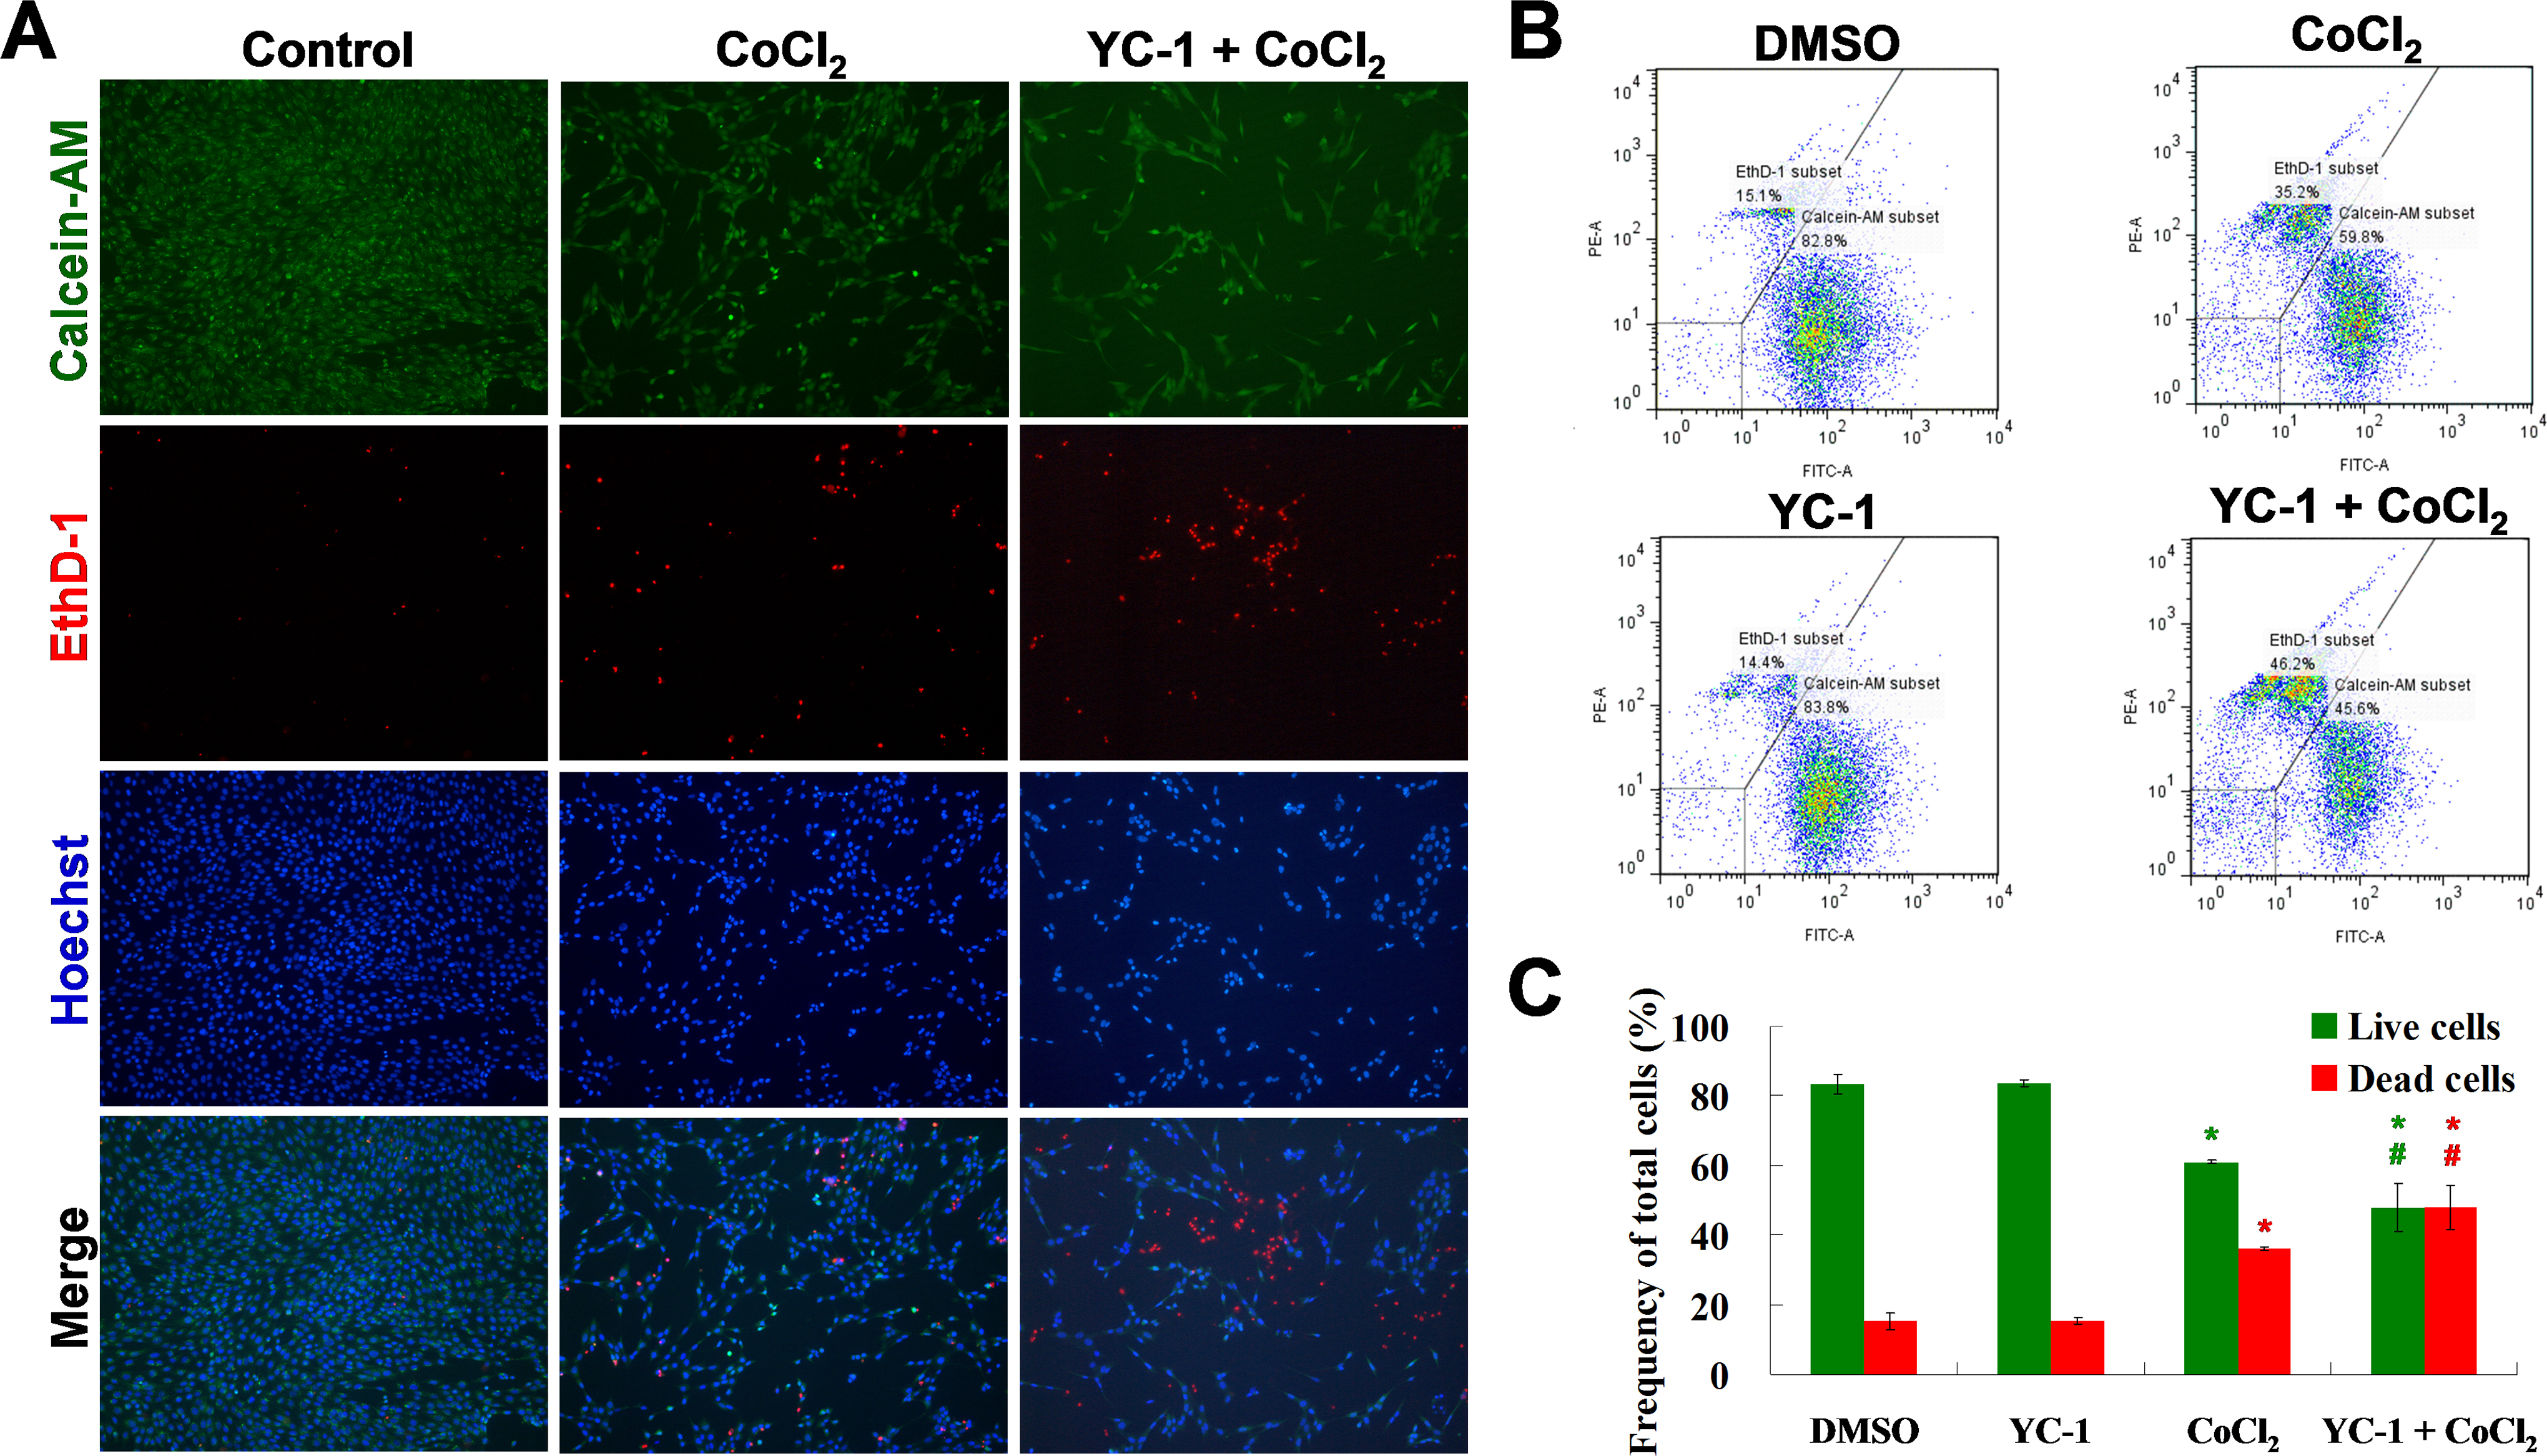
 Figure 2 of
Tsui, Mol Vis 2013; 19:2260-2273.
Figure 2 of
Tsui, Mol Vis 2013; 19:2260-2273.