Figure 4. Electroretinograms of all cases. Bottom row: Electroretinograms (ERGs) of a control subject. No significant interocular asymmetry
was present and data are only shown from one eye of each patient. DA 0.01: dark-adapted 0.01 cd.s.m−2; DA 11.0: dark-adapted 11.0 cd.s.m−2; LA 30 Hz: light-adapted 3.0 cd.s.m−2, 30 Hz flicker; LA 3.0: light-adapted 3.0 cd.s.m−2; PERG: pattern ERG.
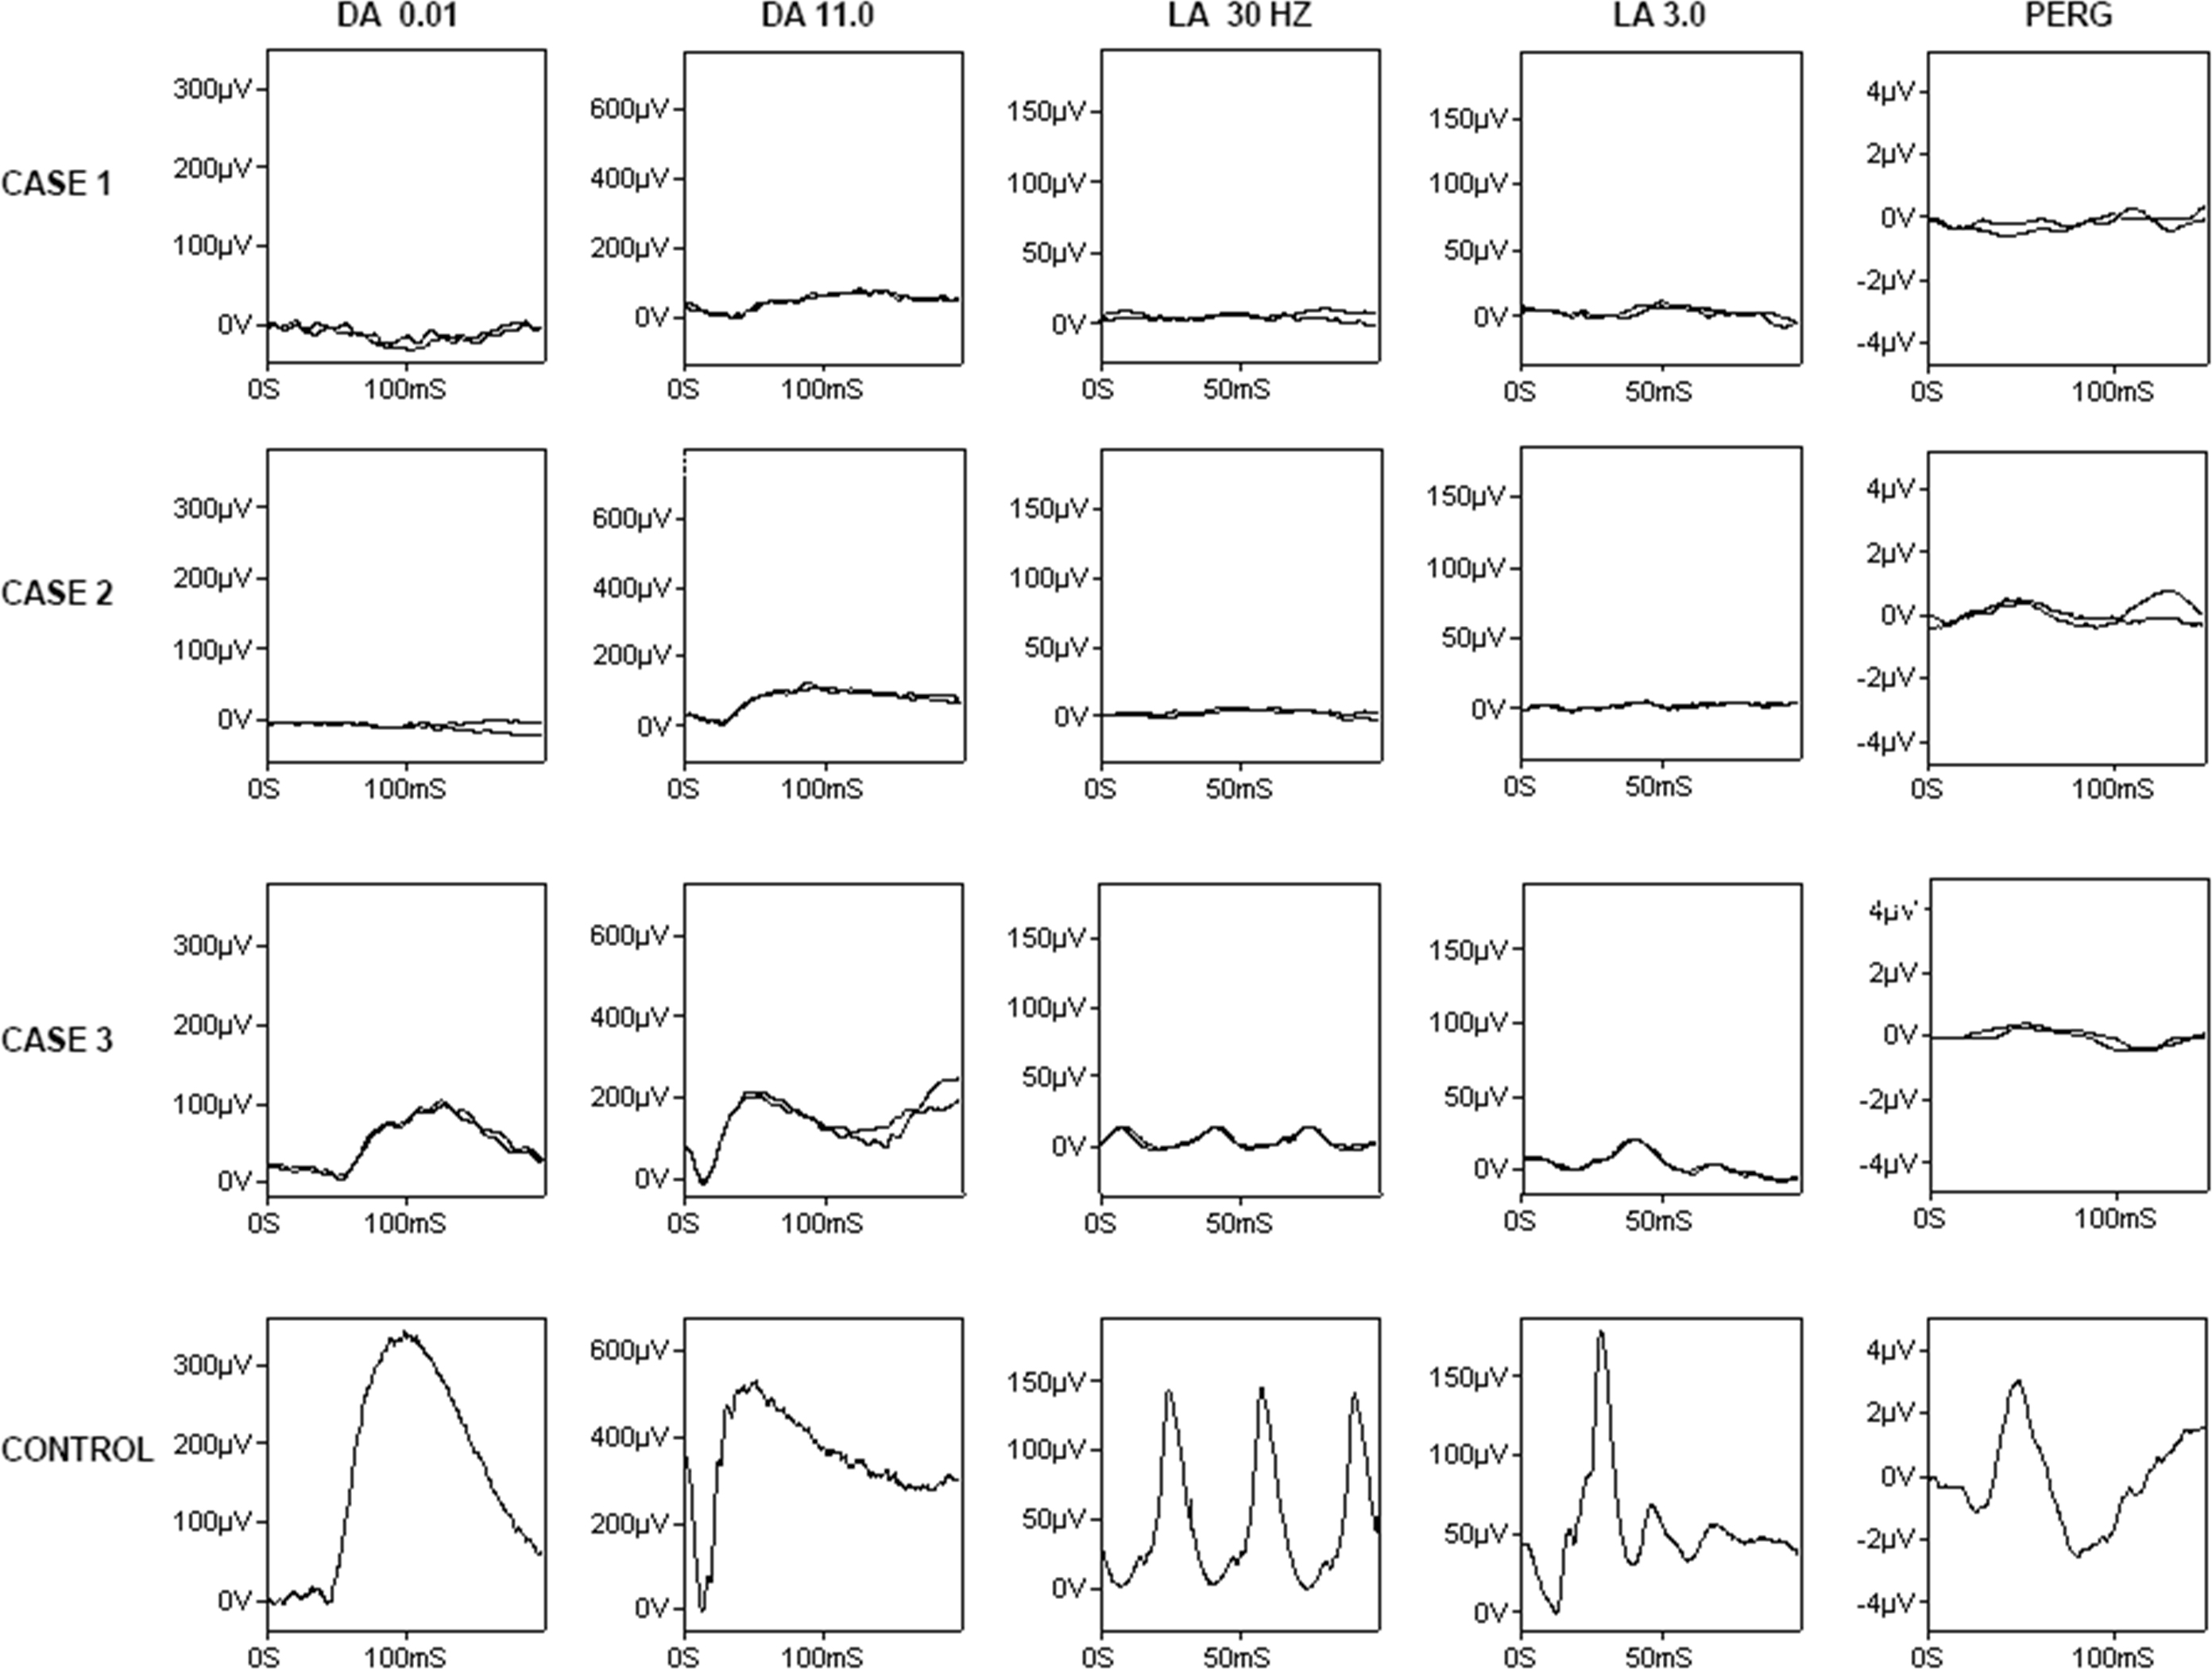
 Figure 4 of
Ba-Abbad, Mol Vis 2013; 19:2250-2259.
Figure 4 of
Ba-Abbad, Mol Vis 2013; 19:2250-2259.