Figure 4. Distinct intracellular signaling pathways mediate apelin-induced proliferation, migration, and collagen I production. A: RPE cells were treated with various kinase inhibitors in the presence of 10−7 M apelin. Blocking apelin-induced RPE cell proliferation by pretreatment with 10 μM LY294002 and 20 μM PD98059 for 30 min,
as measured with MTT assay after 48 h incubation. *p<0.05 versus untreated control. #p<0.05 versus apelin-treated alone. B, C: Inhibition of apelin-induced migration by pretreatment with 10 μM LY294002 and 20 μM PD98059 for 30 min, as measured with
a transwell assay after 6 h incubation (a: control; b: 10−6 M apelin; c: LY294002+10−6 M apelin; d: PD98059+10−6 M apelin. 200× magnification). The number of migrated cells per HPF is shown. *p<0.001 versus untreated control. #p<0.01
versus apelin-treated alone. D: Complete inhibition of apelin-induced collagen I expression by 10 μM LY294002 and 20 μM PD98059. RPE cells were stimulated
with 10−7 M apelin with or without pretreatment with kinase inhibitors for 30 min. After 3 h incubation, RNA was extracted, and collagen
I expression was measured with real-time PCR. *p<0.05 versus untreated control. #p<0.05 versus apelin-treated alone. The data
shown represent the mean±standard deviation (SD) of three independent experiments.
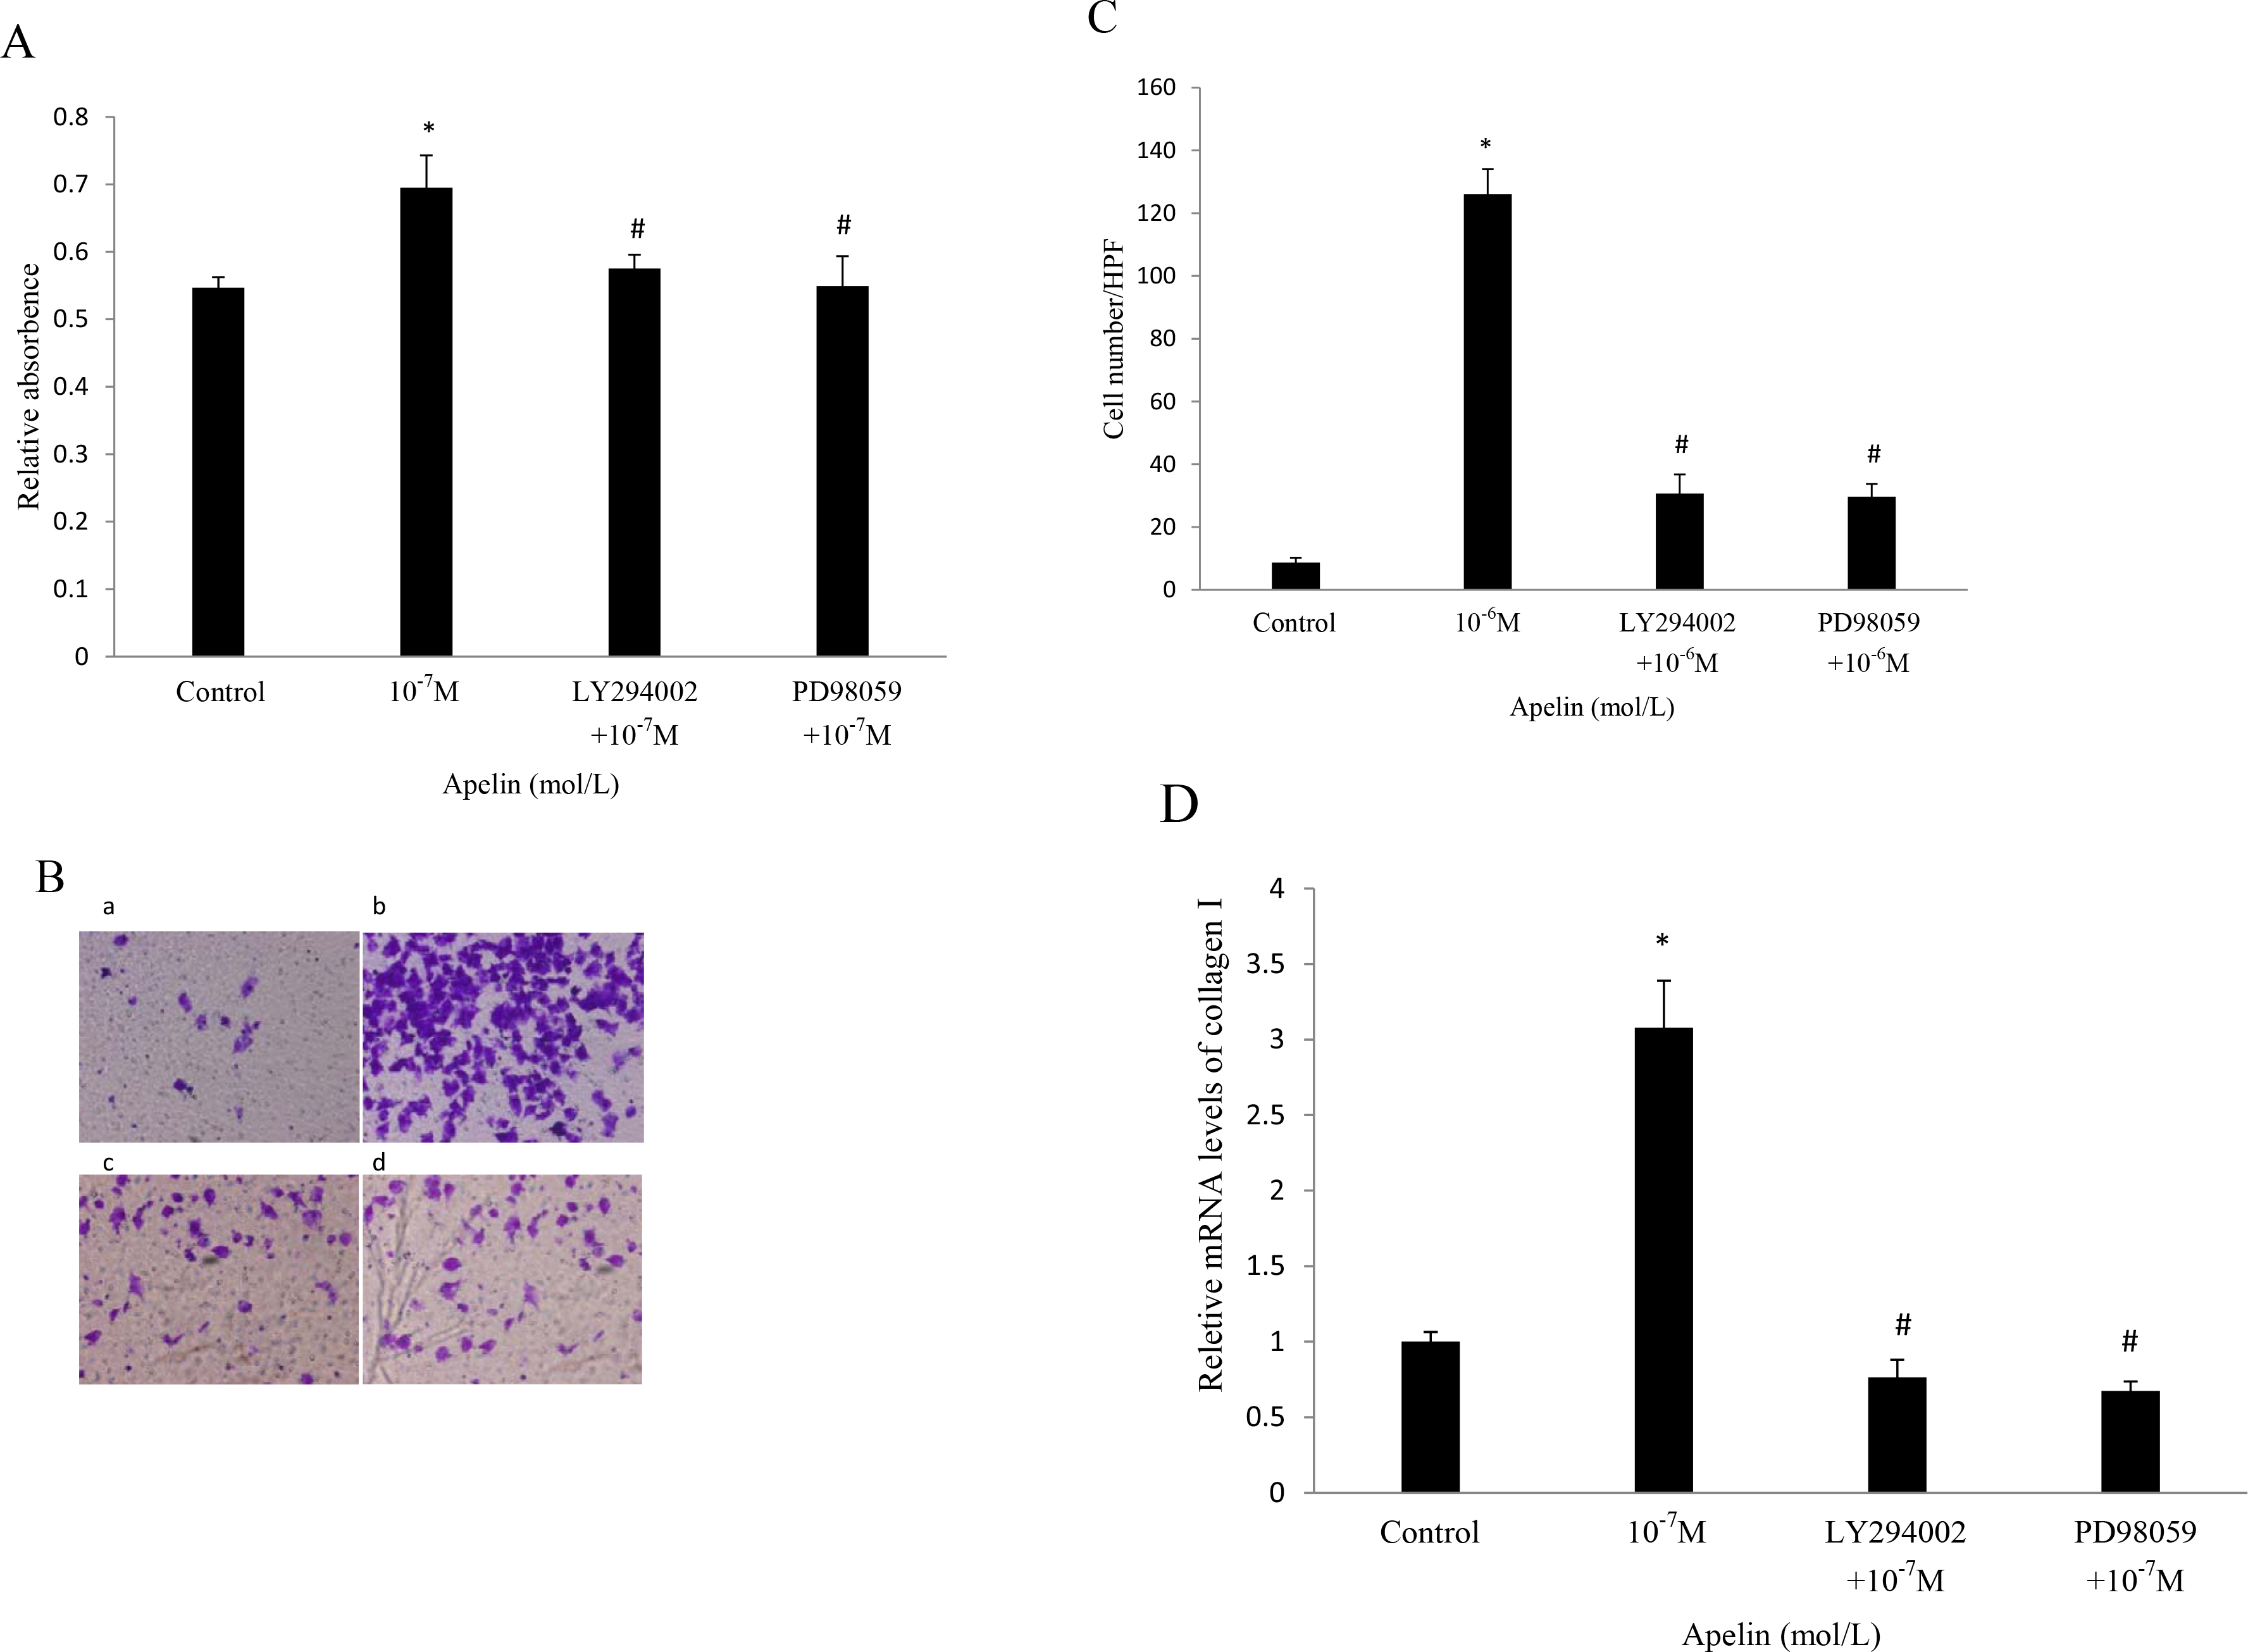
 Figure 4 of
Qin, Mol Vis 2013; 19:2227-2236.
Figure 4 of
Qin, Mol Vis 2013; 19:2227-2236.