Figure 3. Apelin-induced proliferation, migration, and collagen I expression in RPE cells. A: RPE cell proliferation was determined with MTT after 48 h incubation with concentrations of 10−8 M, 10−7 M, and 10−6 M apelin. The 10−8 M and 10−7 M apelin treatment increased RPE cell proliferation. *p<0.05 versus untreated control. B, C: RPE cell migration in response to apelin treatment was measured using a transwell assay (a: control; b: 10−8 M apelin; c: 10−7 M apelin; d: 10−6 M apelin. 200X magnification). The values were assessed by the mean number of migrated cells. The number of migrated cells
per high power field (HPF) is shown. *p<0.001 versus untreated control. D: Collagen I expression in RPE cells was determined with real-time PCR. Time-dependent induction of collagen I expression
after stimulation with 10−7 M apelin. *p<0.05 versus untreated control. The data are expressed as means±standard deviation (SD), and the experiments
were performed independently three times.
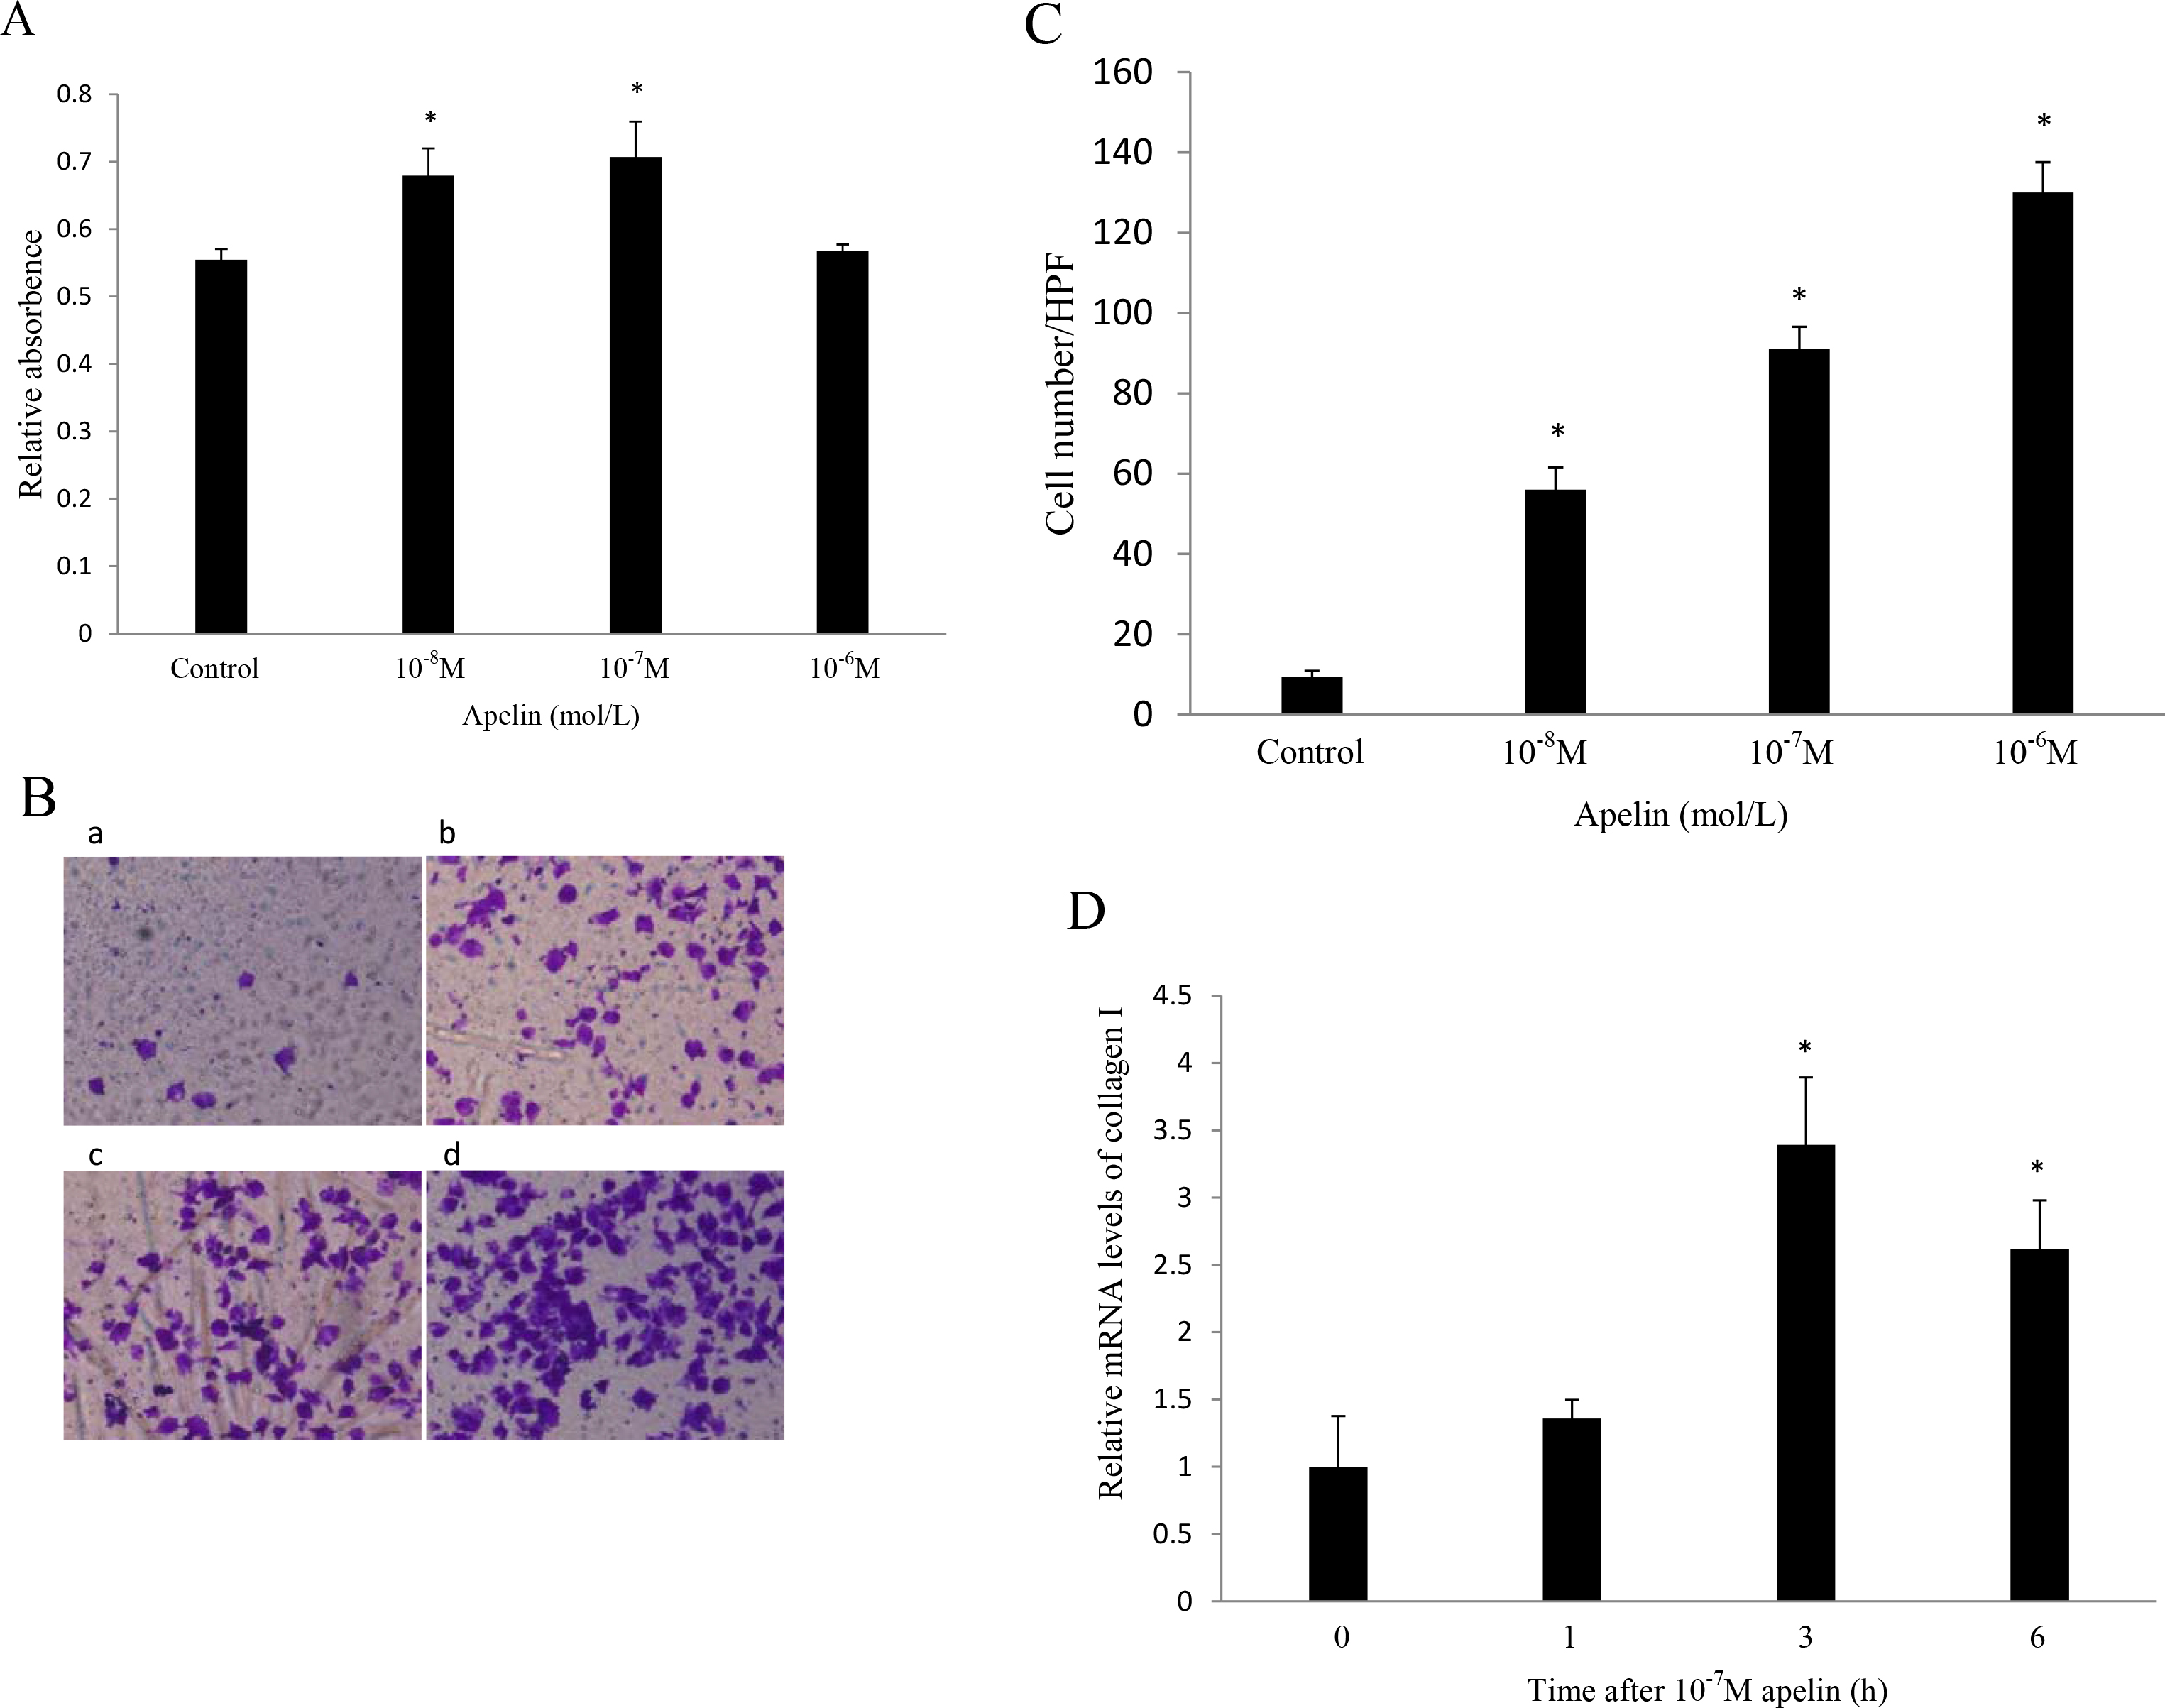
 Figure 3 of
Qin, Mol Vis 2013; 19:2227-2236.
Figure 3 of
Qin, Mol Vis 2013; 19:2227-2236.