Figure 1. Effect of high glucose concentration on apelin expression in RPE cells. A: Real-time PCR analysis of apelin mRNA expression. RPE cells were exposed to normal glucose (NG) and high glucose (HG) for
48 h. Compared with the NG, the expression of apelin was upregulated in response to HG. B: Western blot analysis of apelin protein expression. RPE cells were exposed to NG and HG for 48 h. C: The expression of apelin on protein increased under HG conditions compared with NG. NG and HG represent the normal glucose
group and the high glucose group. The data shown represent the mean±standard deviation (SD) of three independent experiments,
*p<0.05 versus NG.
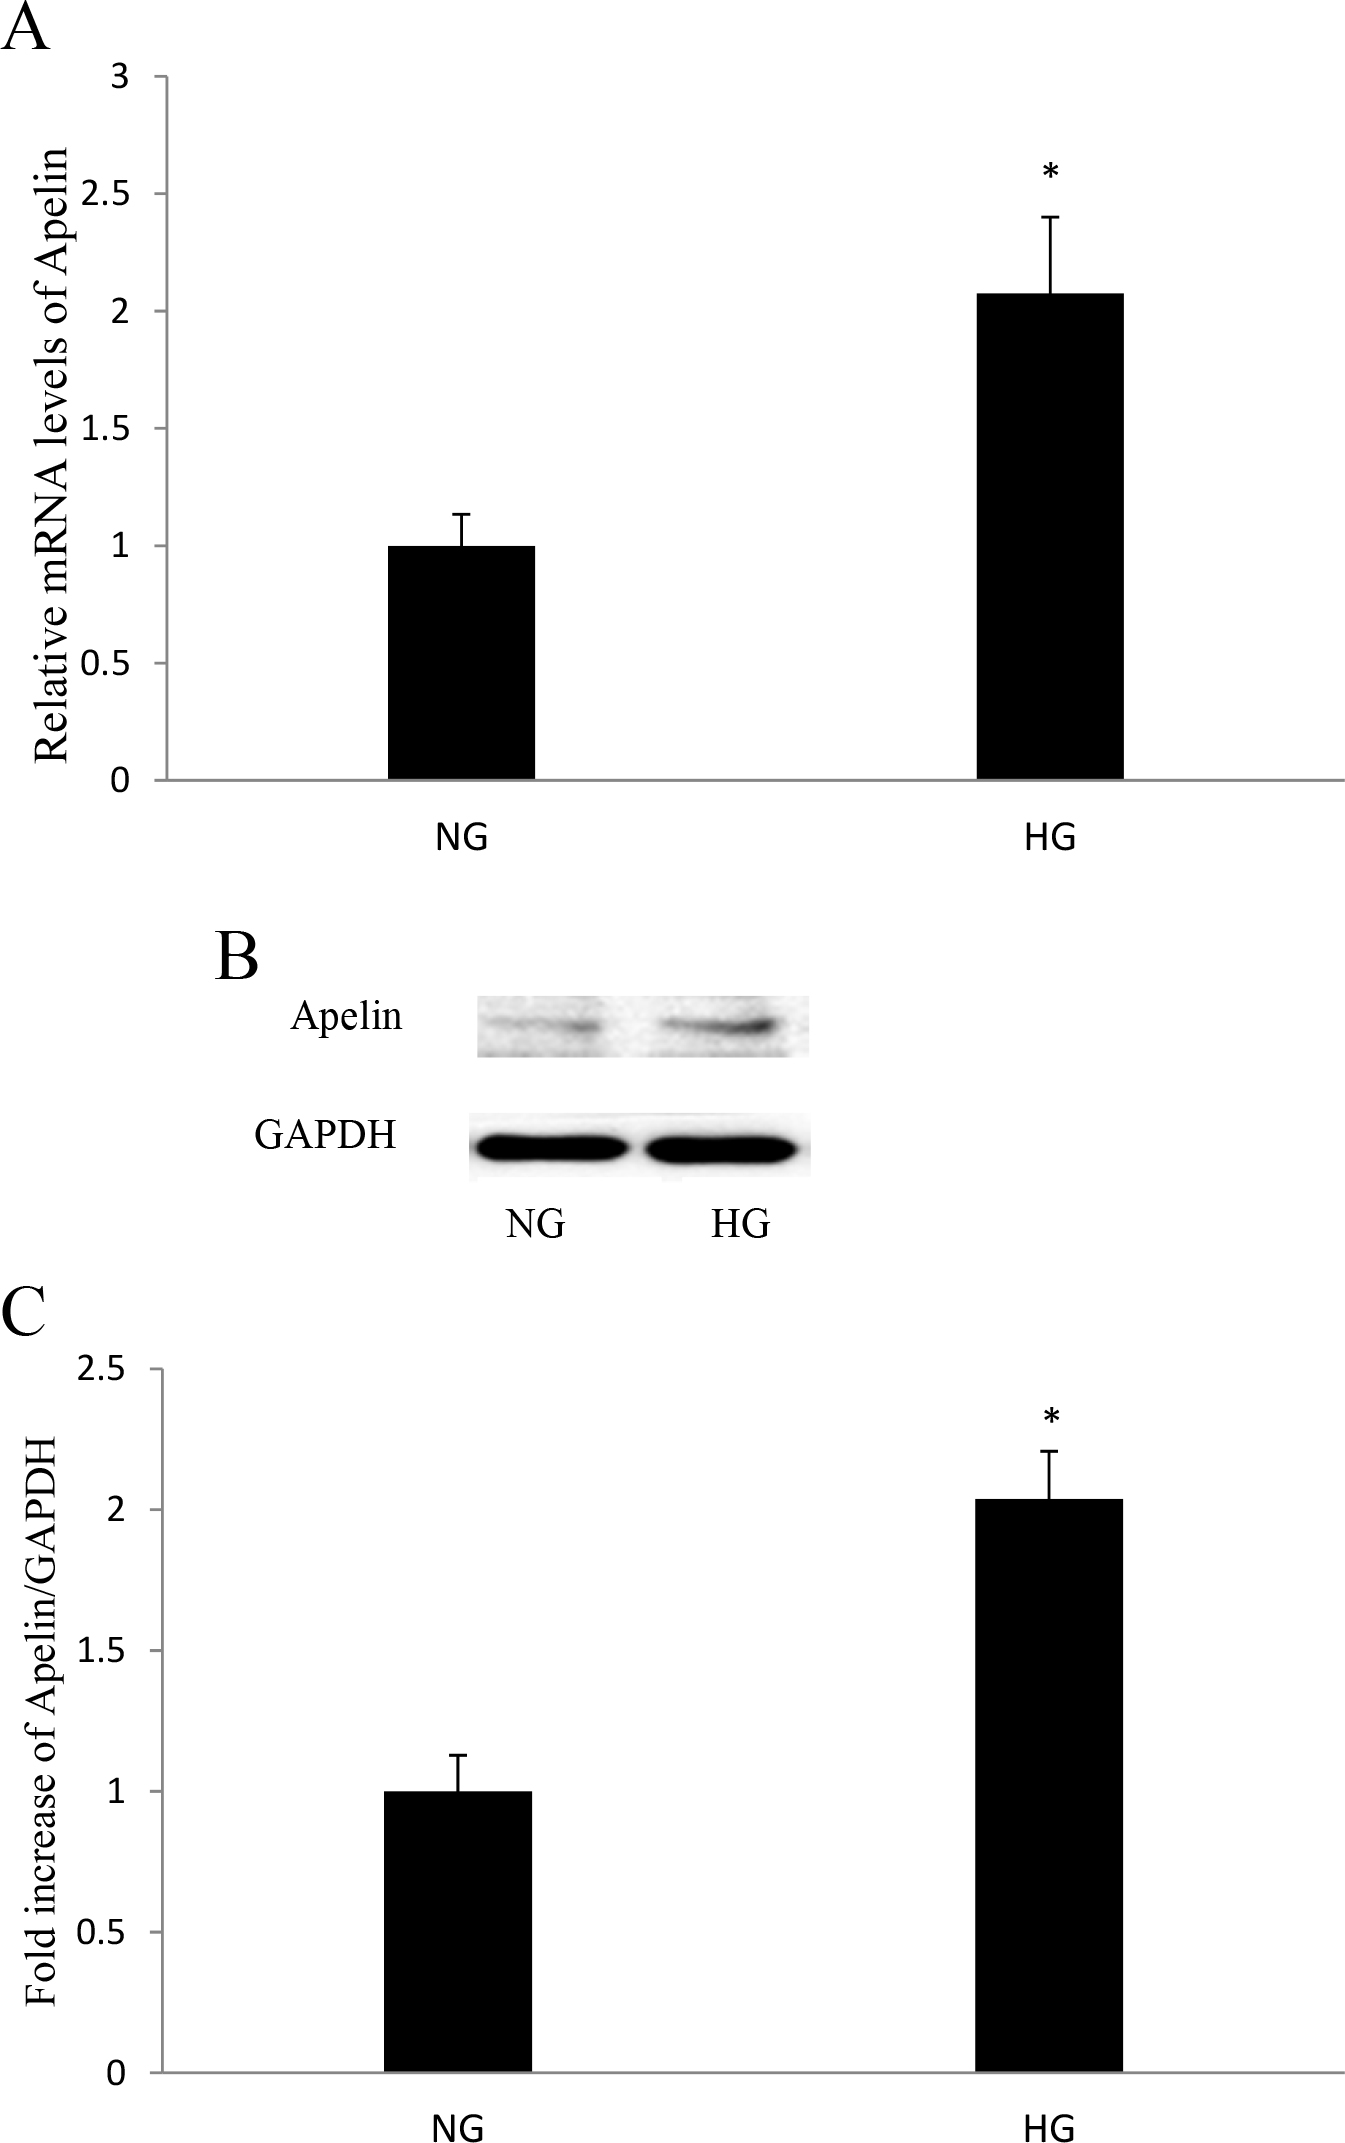
 Figure 1 of
Qin, Mol Vis 2013; 19:2227-2236.
Figure 1 of
Qin, Mol Vis 2013; 19:2227-2236.