Figure 4 of
D’Souza, Mol Vis 2013; 19:2209-2216.
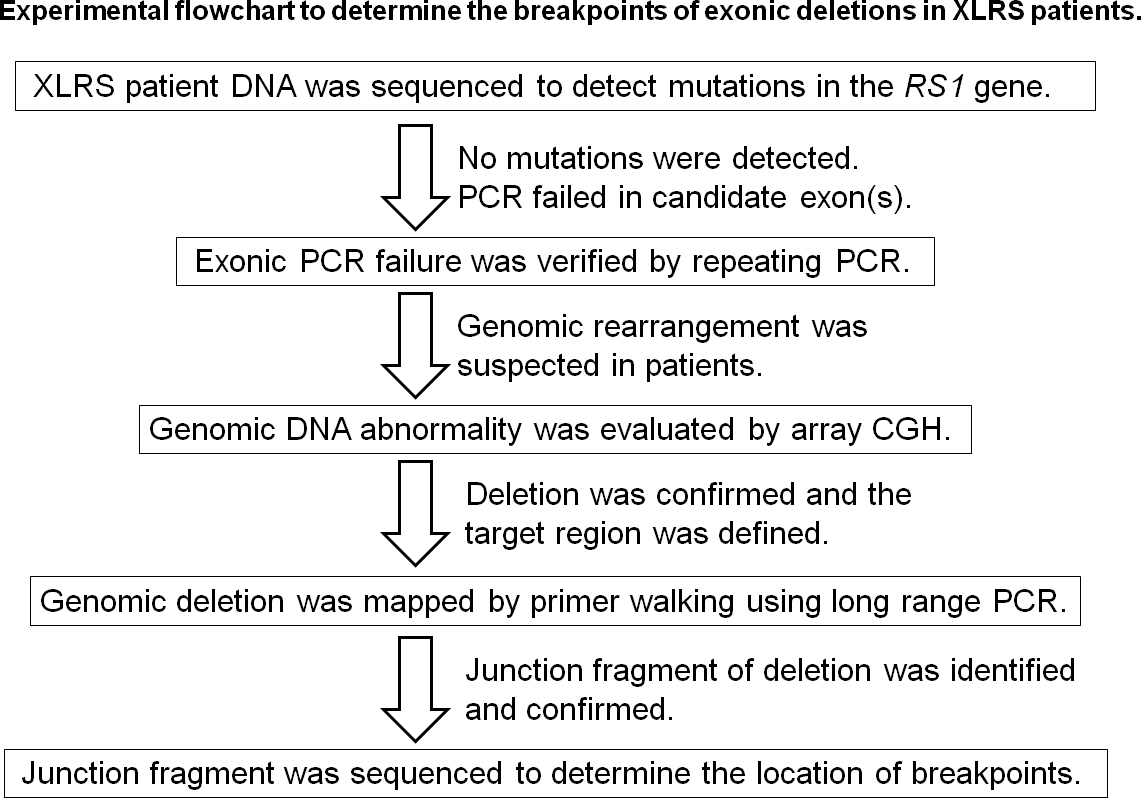
Figure 4.
Experimental flowchart to determine the breakpoints of exonic deletions in patients with XLRS.
 Figure 4 of
D’Souza, Mol Vis 2013; 19:2209-2216. Figure 4 of
D’Souza, Mol Vis 2013; 19:2209-2216.
Figure 4 of
D’Souza, Mol Vis 2013; 19:2209-2216. Figure 4 of
D’Souza, Mol Vis 2013; 19:2209-2216.