Figure 3. Determination of breakpoints in the RS1 gene gross genomic deletion in patient #22 and confirmation of maternal carrier status. A: Schematic Diagram of RS1 gene exon 3 to exon 6 region for primer walk in patient #22 (not scaled). The results of long range PCR using different combinations
of designed primers (Appendix 2) are not shown. B: PCR products using primer pair w12F/w14R were analyzed by using pre-cast 1% agarose gels stained with ethidium bromide (SeaKem®
Gold Agarose, Lonza Rockland Inc, Rockland, ME). The gel shows the amplification of the deletion junction fragment in the
patient. Lanes 1 & 7 were loaded with supercoiled DNA Ladder (0.01 mg/ml, Life technologies, Grand Island, CA). Lane 2 used
the DNA from patient's mother. Lane 3 used DNA from patient #22 (son). Lanes 4 & 5 used DNA from two unrelated samples as
wild type PCR product references. Lane 6 used non-DNA water as PCR control. The top band in lanes 2, 4, and 5 represents the
wild type fragment with an estimated size of about 7 kb. The lower band represents the junction fragment with an estimated
size of about 0.8 kb. The blue arrow indicates the isolated fragment used for sequencing. C: Junction fragments were sequenced to determine the exact breakpoints in intron 3 and intron 5 and results of sequencing
by using primers w12F (forward direction, top) and w14R (reverse direction, bottom) are shown.
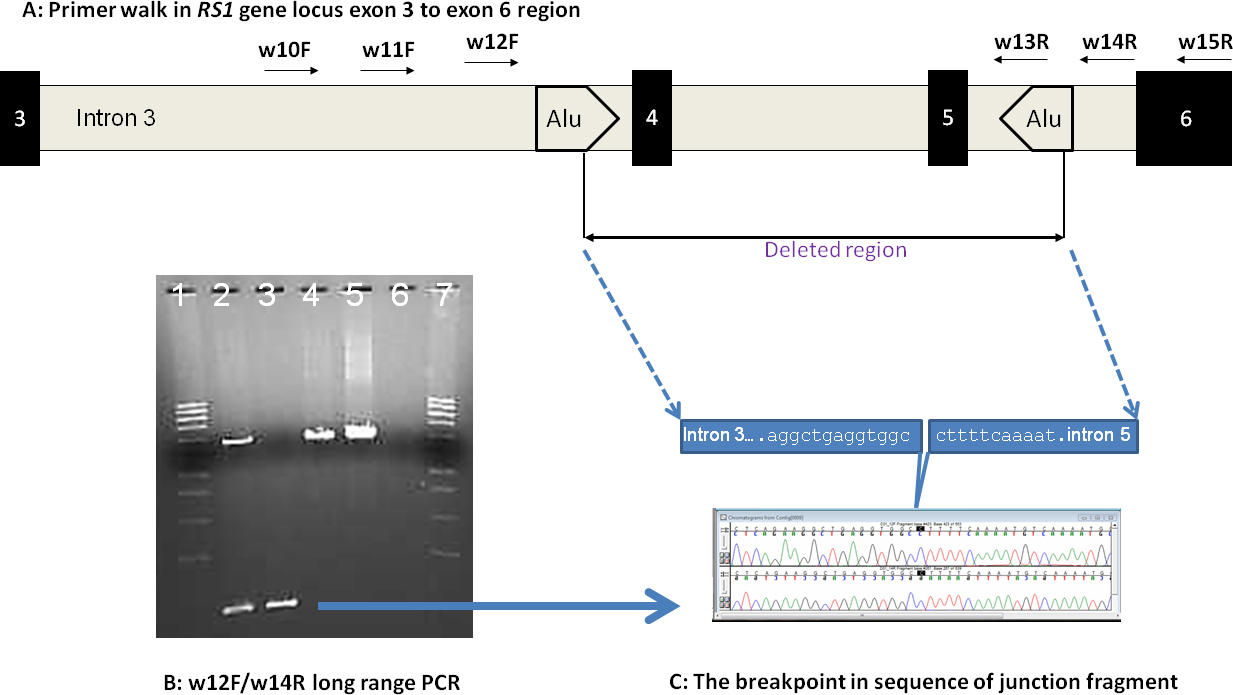
 Figure 3 of
D’Souza, Mol Vis 2013; 19:2209-2216.
Figure 3 of
D’Souza, Mol Vis 2013; 19:2209-2216.