Figure 4. Tandem mass spectrum of the N-terminal peptide M*DVTIQHPWFK of αA-crystallin from spot 5 (m/z 1459.7). M* corresponds to acetylated
and oxidized methionine. The signals in the spectrum are assigned as follows: y- (blue), b- (red), and a- (green) ions. The
identified fragments are marked above the signals. The diagram of y- and b-ion formation is presented in the chart above the
spectrum.
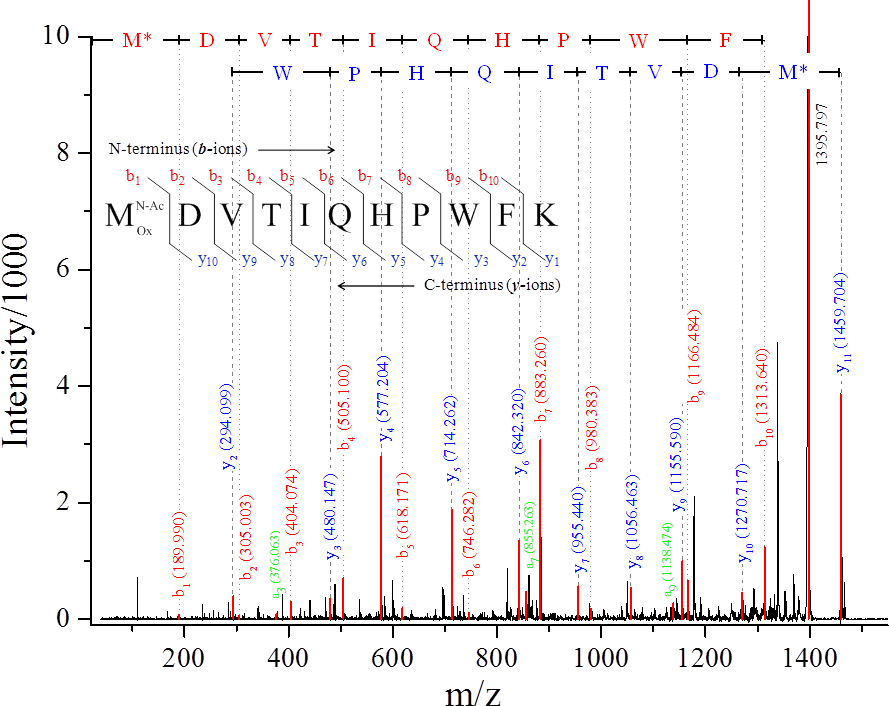
 Figure 4 of
Yanshole, Mol Vis 2013; 19:2196-2208.
Figure 4 of
Yanshole, Mol Vis 2013; 19:2196-2208.