Figure 3. Relative abundances of urea-soluble crystallins extracted from lenses of Wistar and OXYS rats. Solid bars show the values
for 3-week-old animals, open bars for 12-week-old animals, and hatched bars for 62-week-old animals. The error bars show standard
deviations. The asterisk indicates statistically significant (p<0.05) interstrain differences.
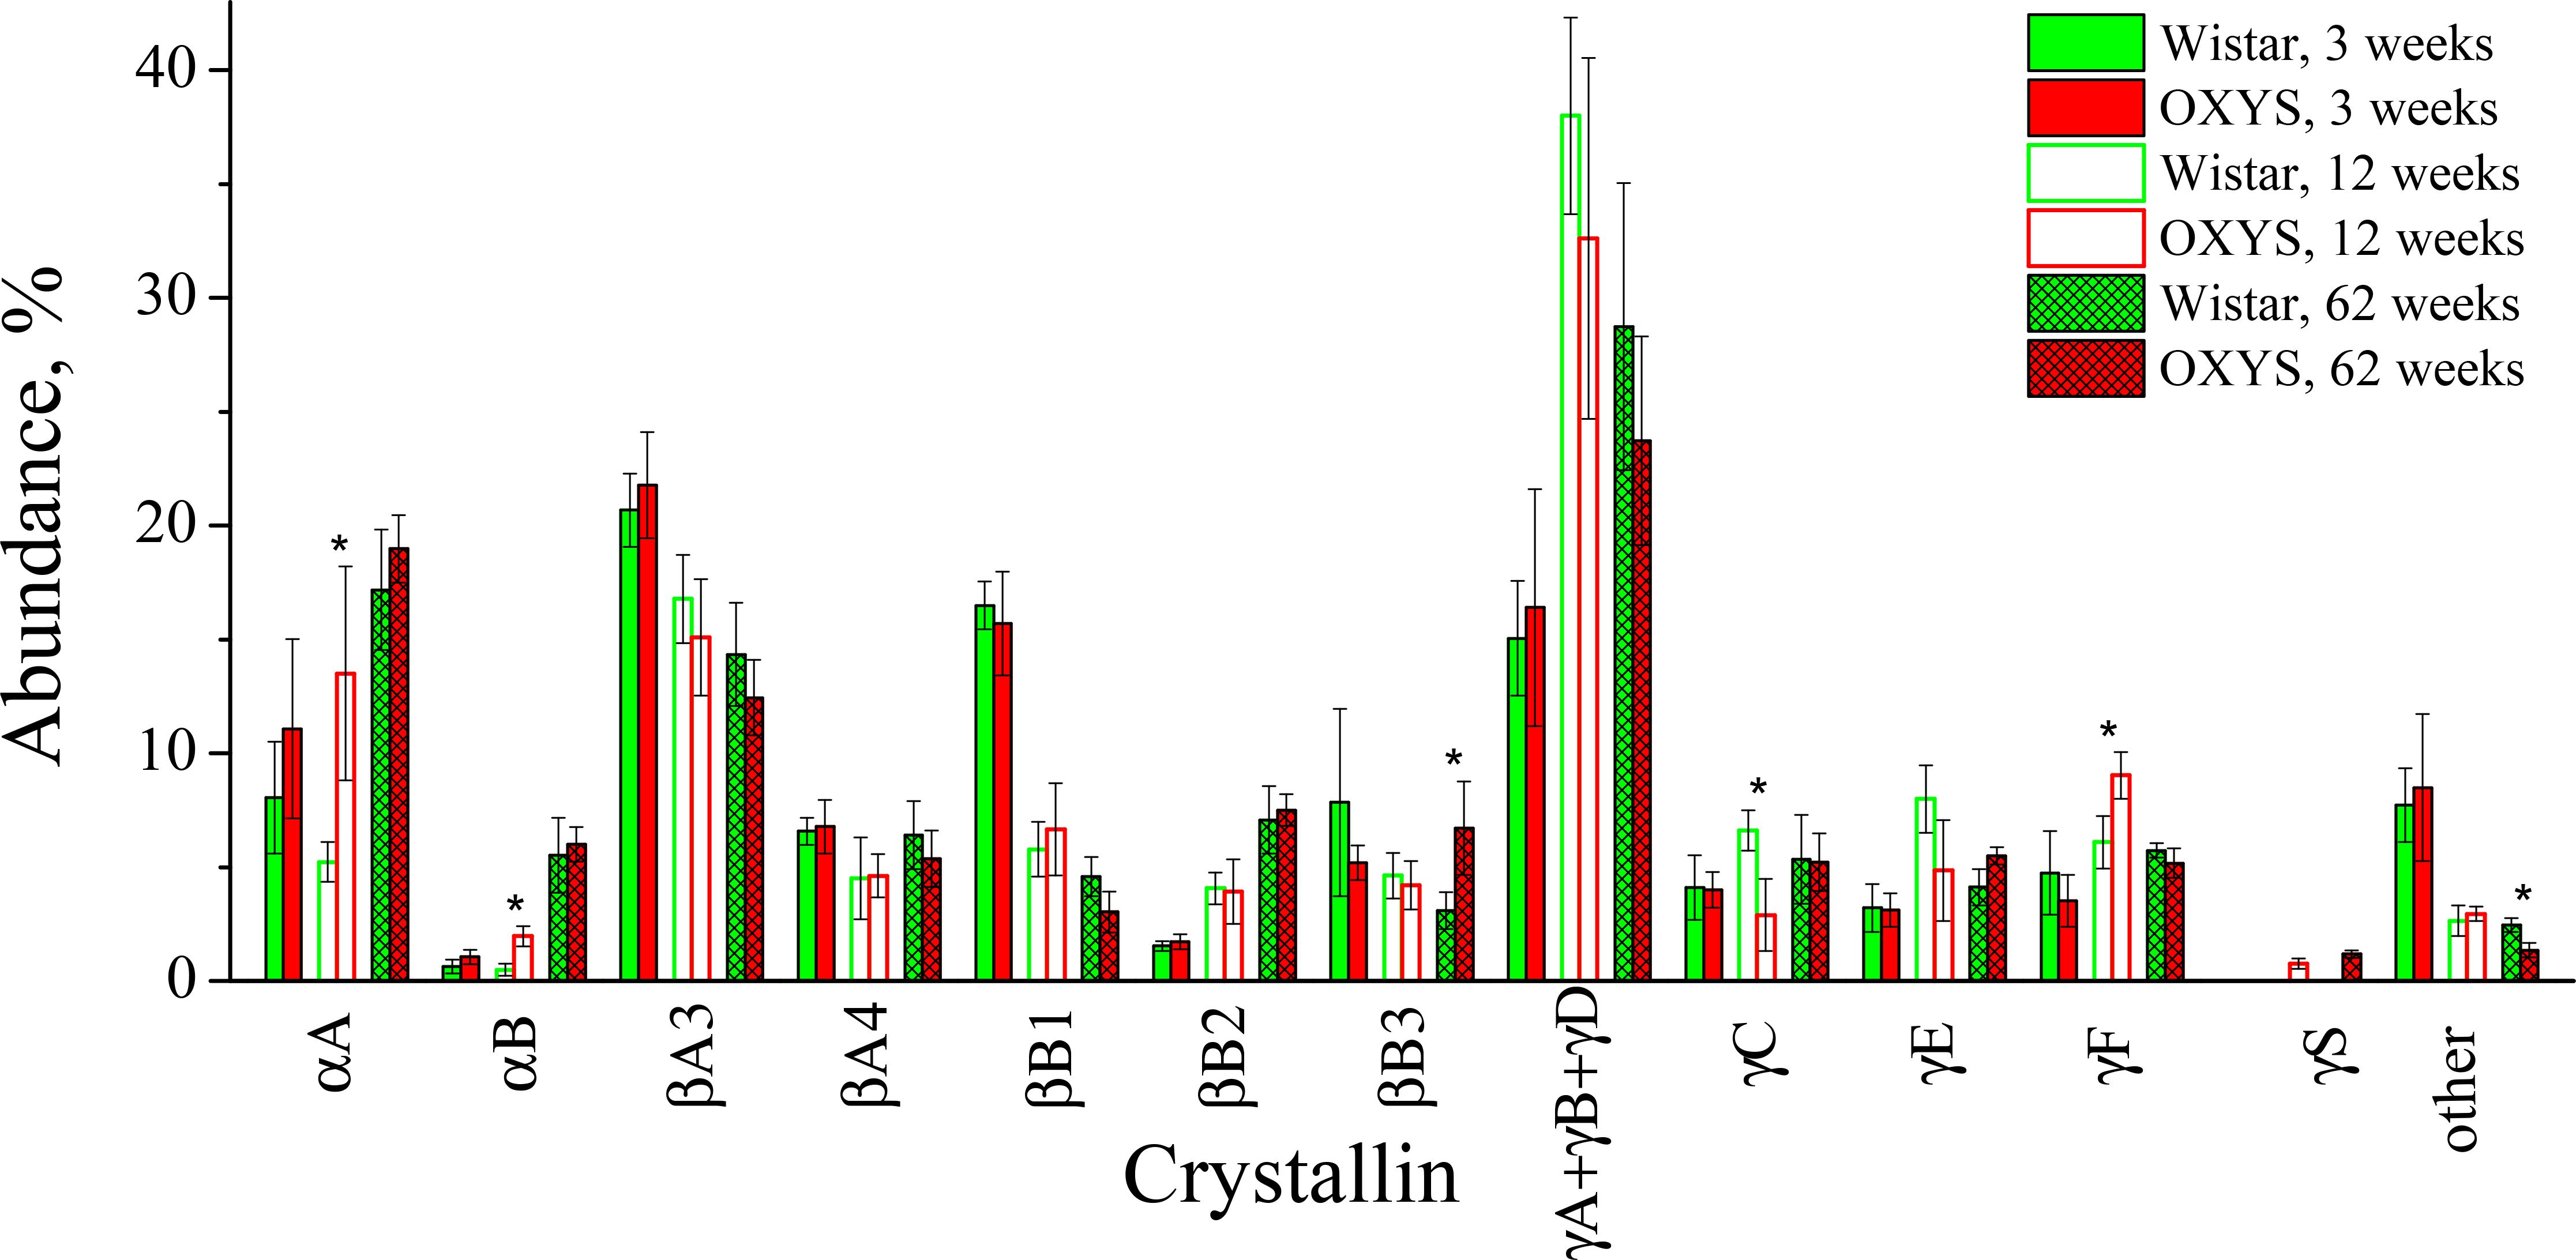
 Figure 3 of
Yanshole, Mol Vis 2013; 19:2196-2208.
Figure 3 of
Yanshole, Mol Vis 2013; 19:2196-2208.