Figure 1. Two-dimensional electrophoresis maps of urea-soluble protein fractions from lenses of 3-, 12-, and 62-week-old Wistar and
OXYS rats. Red circles mark cataract-specific spots of interest (SOIcs; spot intensity in OXYS maps are more than 50% higher than in Wistar maps); yellow circles mark age-related spots of interest
(SOIar; spot intensity in OXYS maps are more than 50% lower than in Wistar maps).
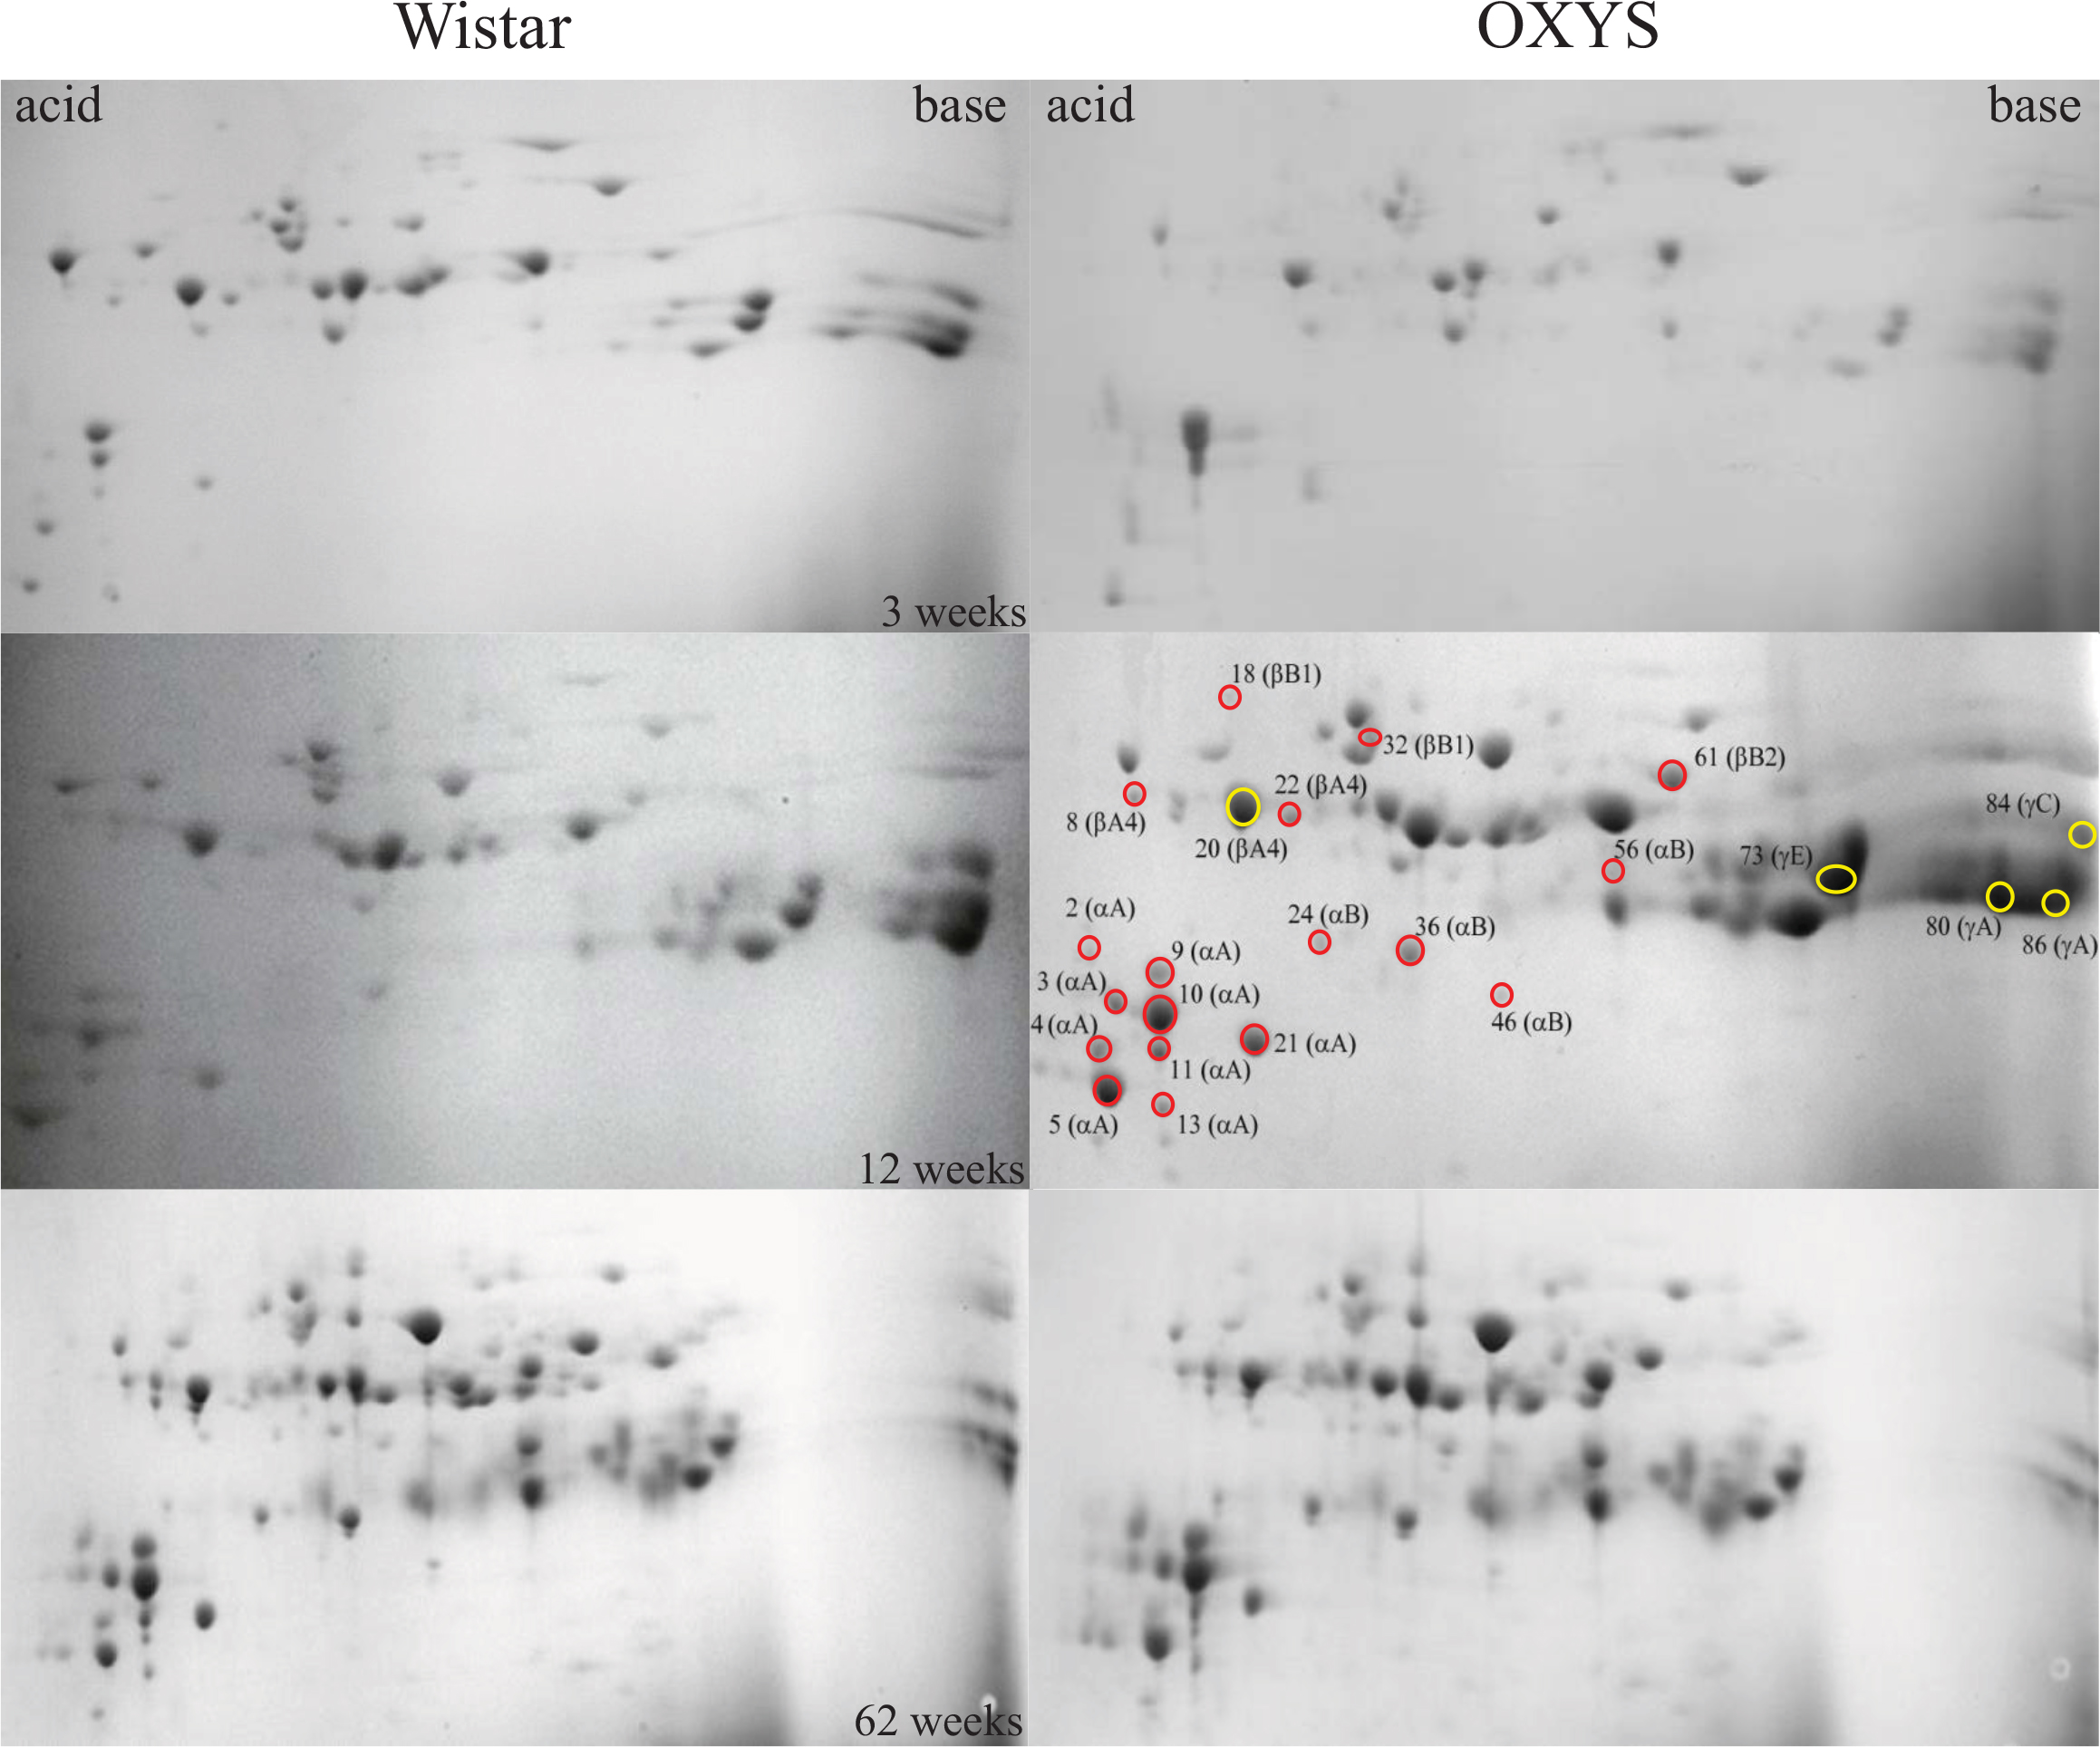
 Figure 1 of
Yanshole, Mol Vis 2013; 19:2196-2208.
Figure 1 of
Yanshole, Mol Vis 2013; 19:2196-2208.