Figure 9. The average force required to extend the cornea over 500 µm in the cross-linking group and the control group. In the control
groups (dashed line), extension of the cornea required a gradual and uniform increase in the force. By comparison, greater
force was necessary to extend the cross-linked corneas (solid line) over 500 µm. The error bars represent the standard deviation
of force between animals in each group.
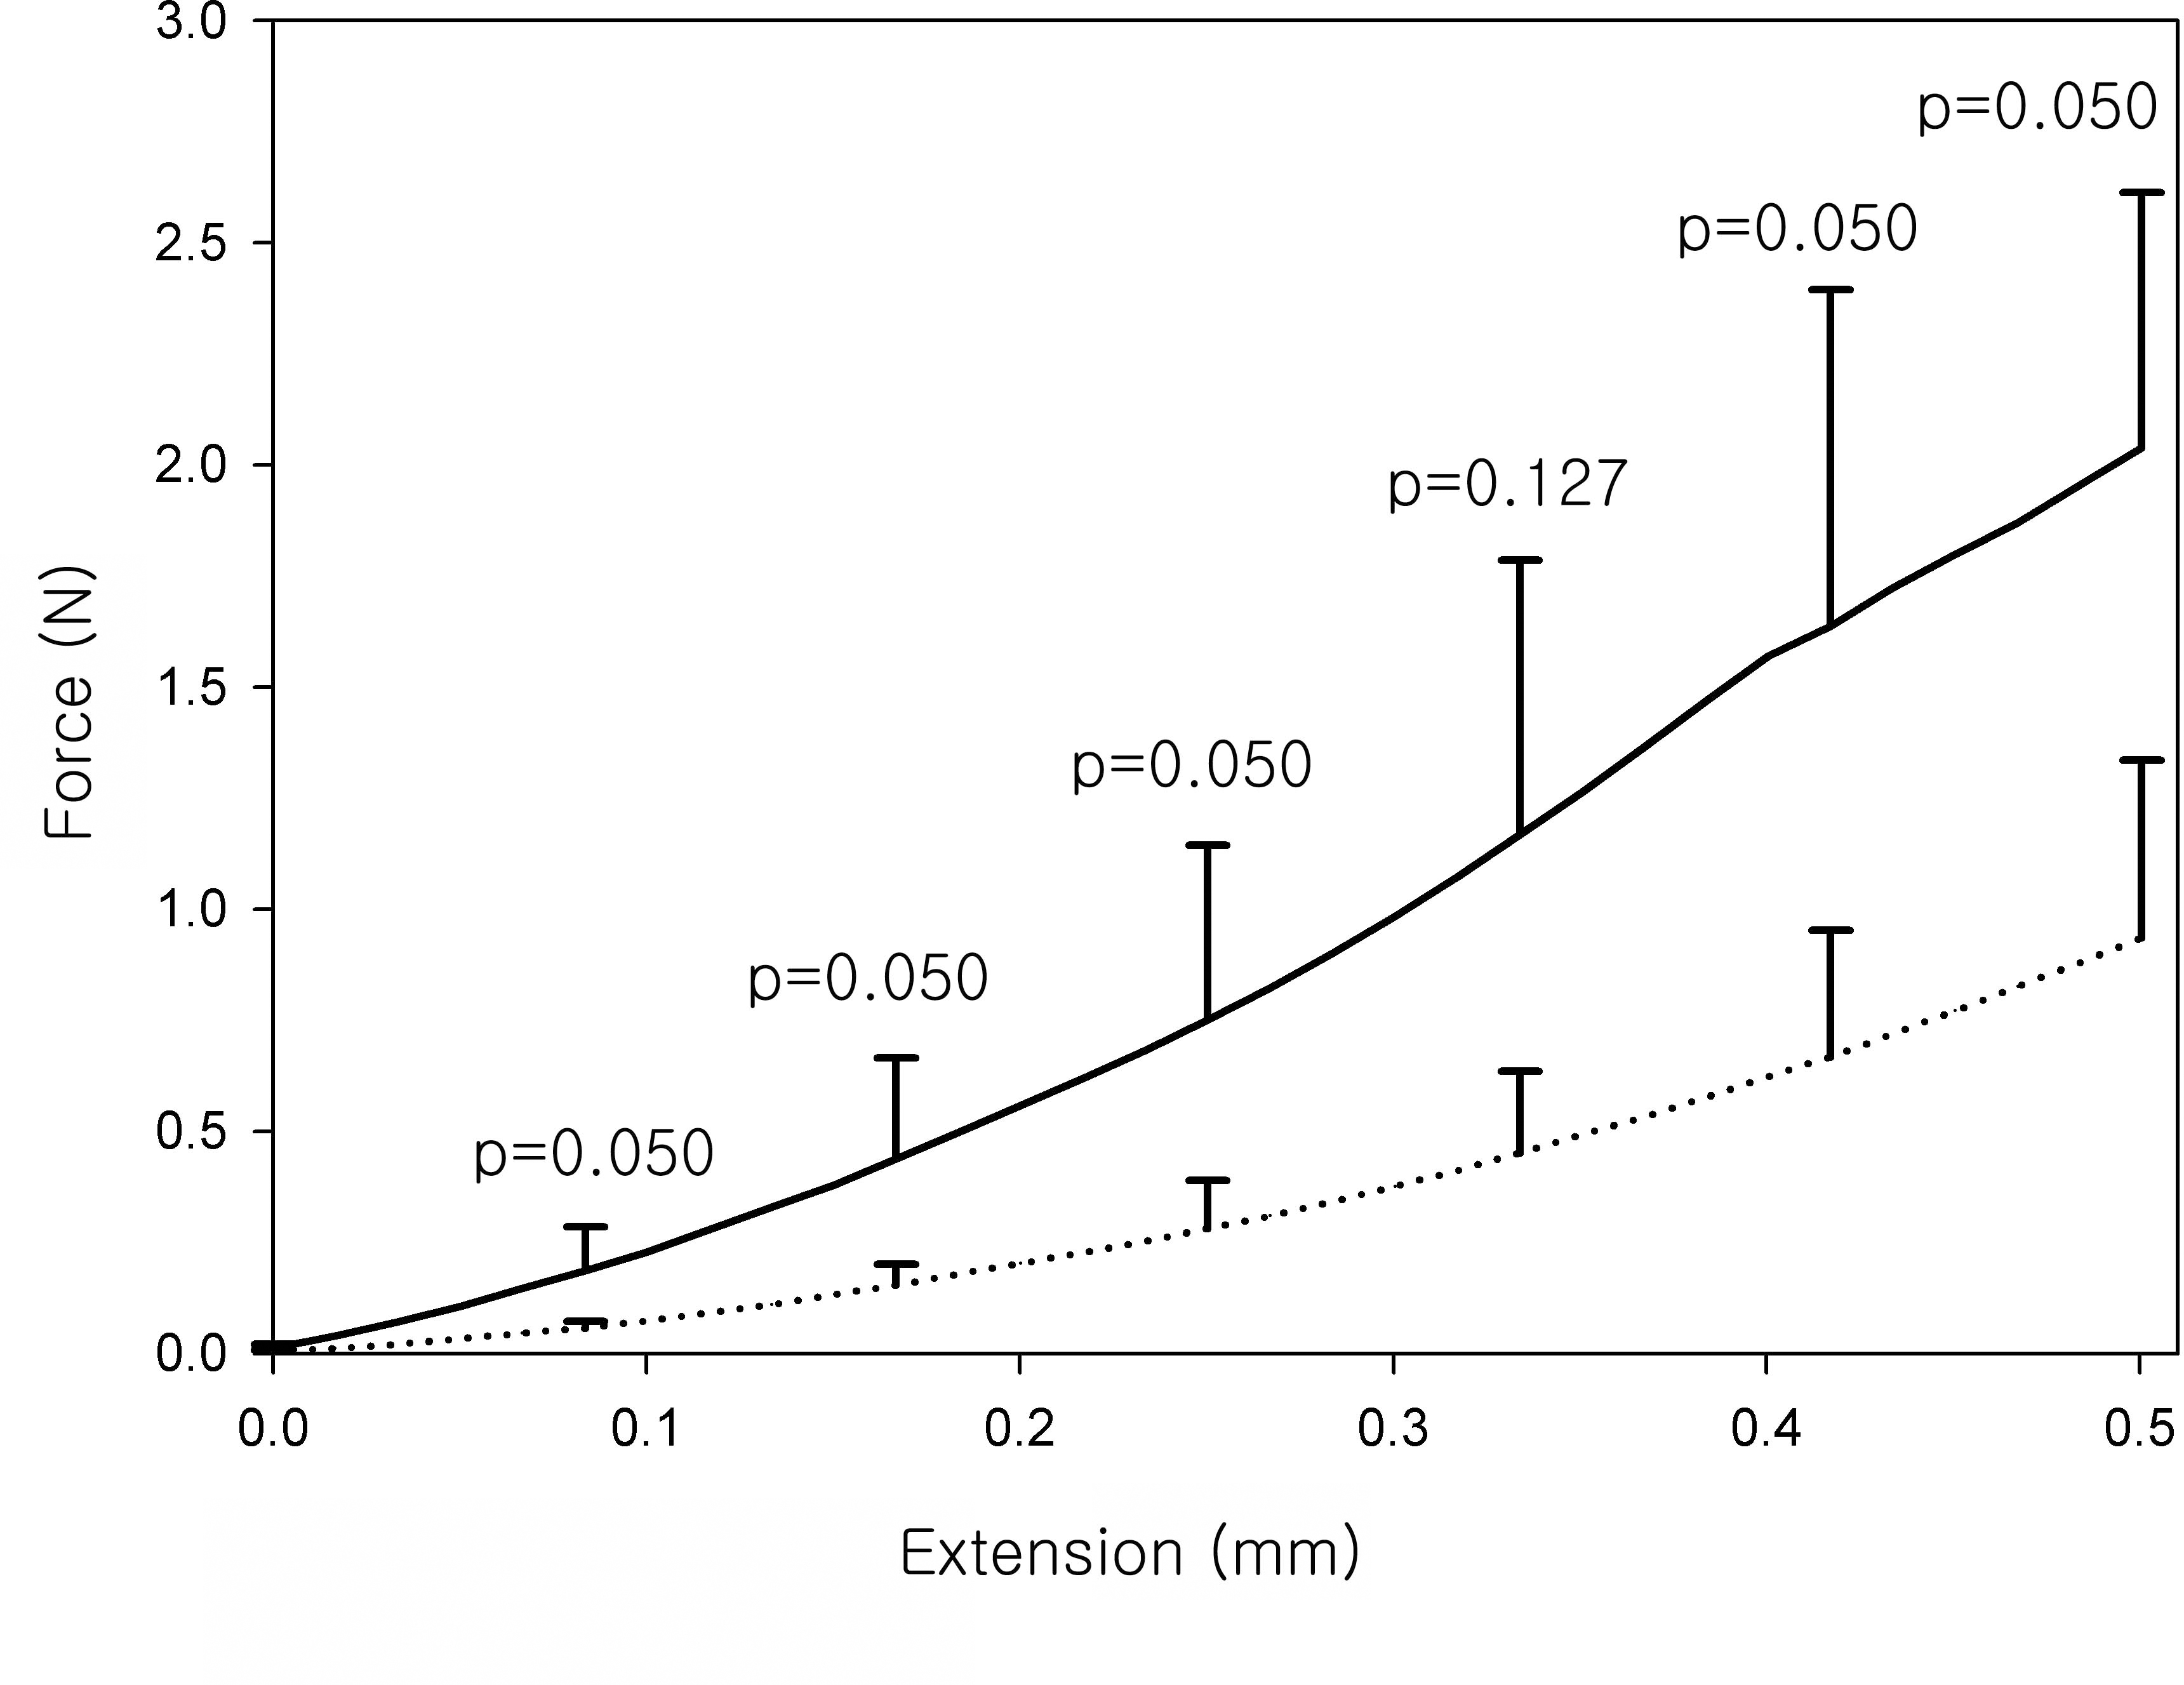
 Figure 9 of
Hwang, Mol Vis 2013; 19:2113-2123.
Figure 9 of
Hwang, Mol Vis 2013; 19:2113-2123.