Figure 8. The difference between the transmittance of the control corneas and that of the cross-linked corneas of three rabbits (#6,
#9, and #11) and the other seven rabbits. The solid line represents those whose corneal thickness differences were less than
7 µm (#6, #9, and #11), and the dashed line represents the remaining rabbits. The transmittance difference of the three rabbits
was 3%–4% less than the others, but the overall pattern was similar between the groups.
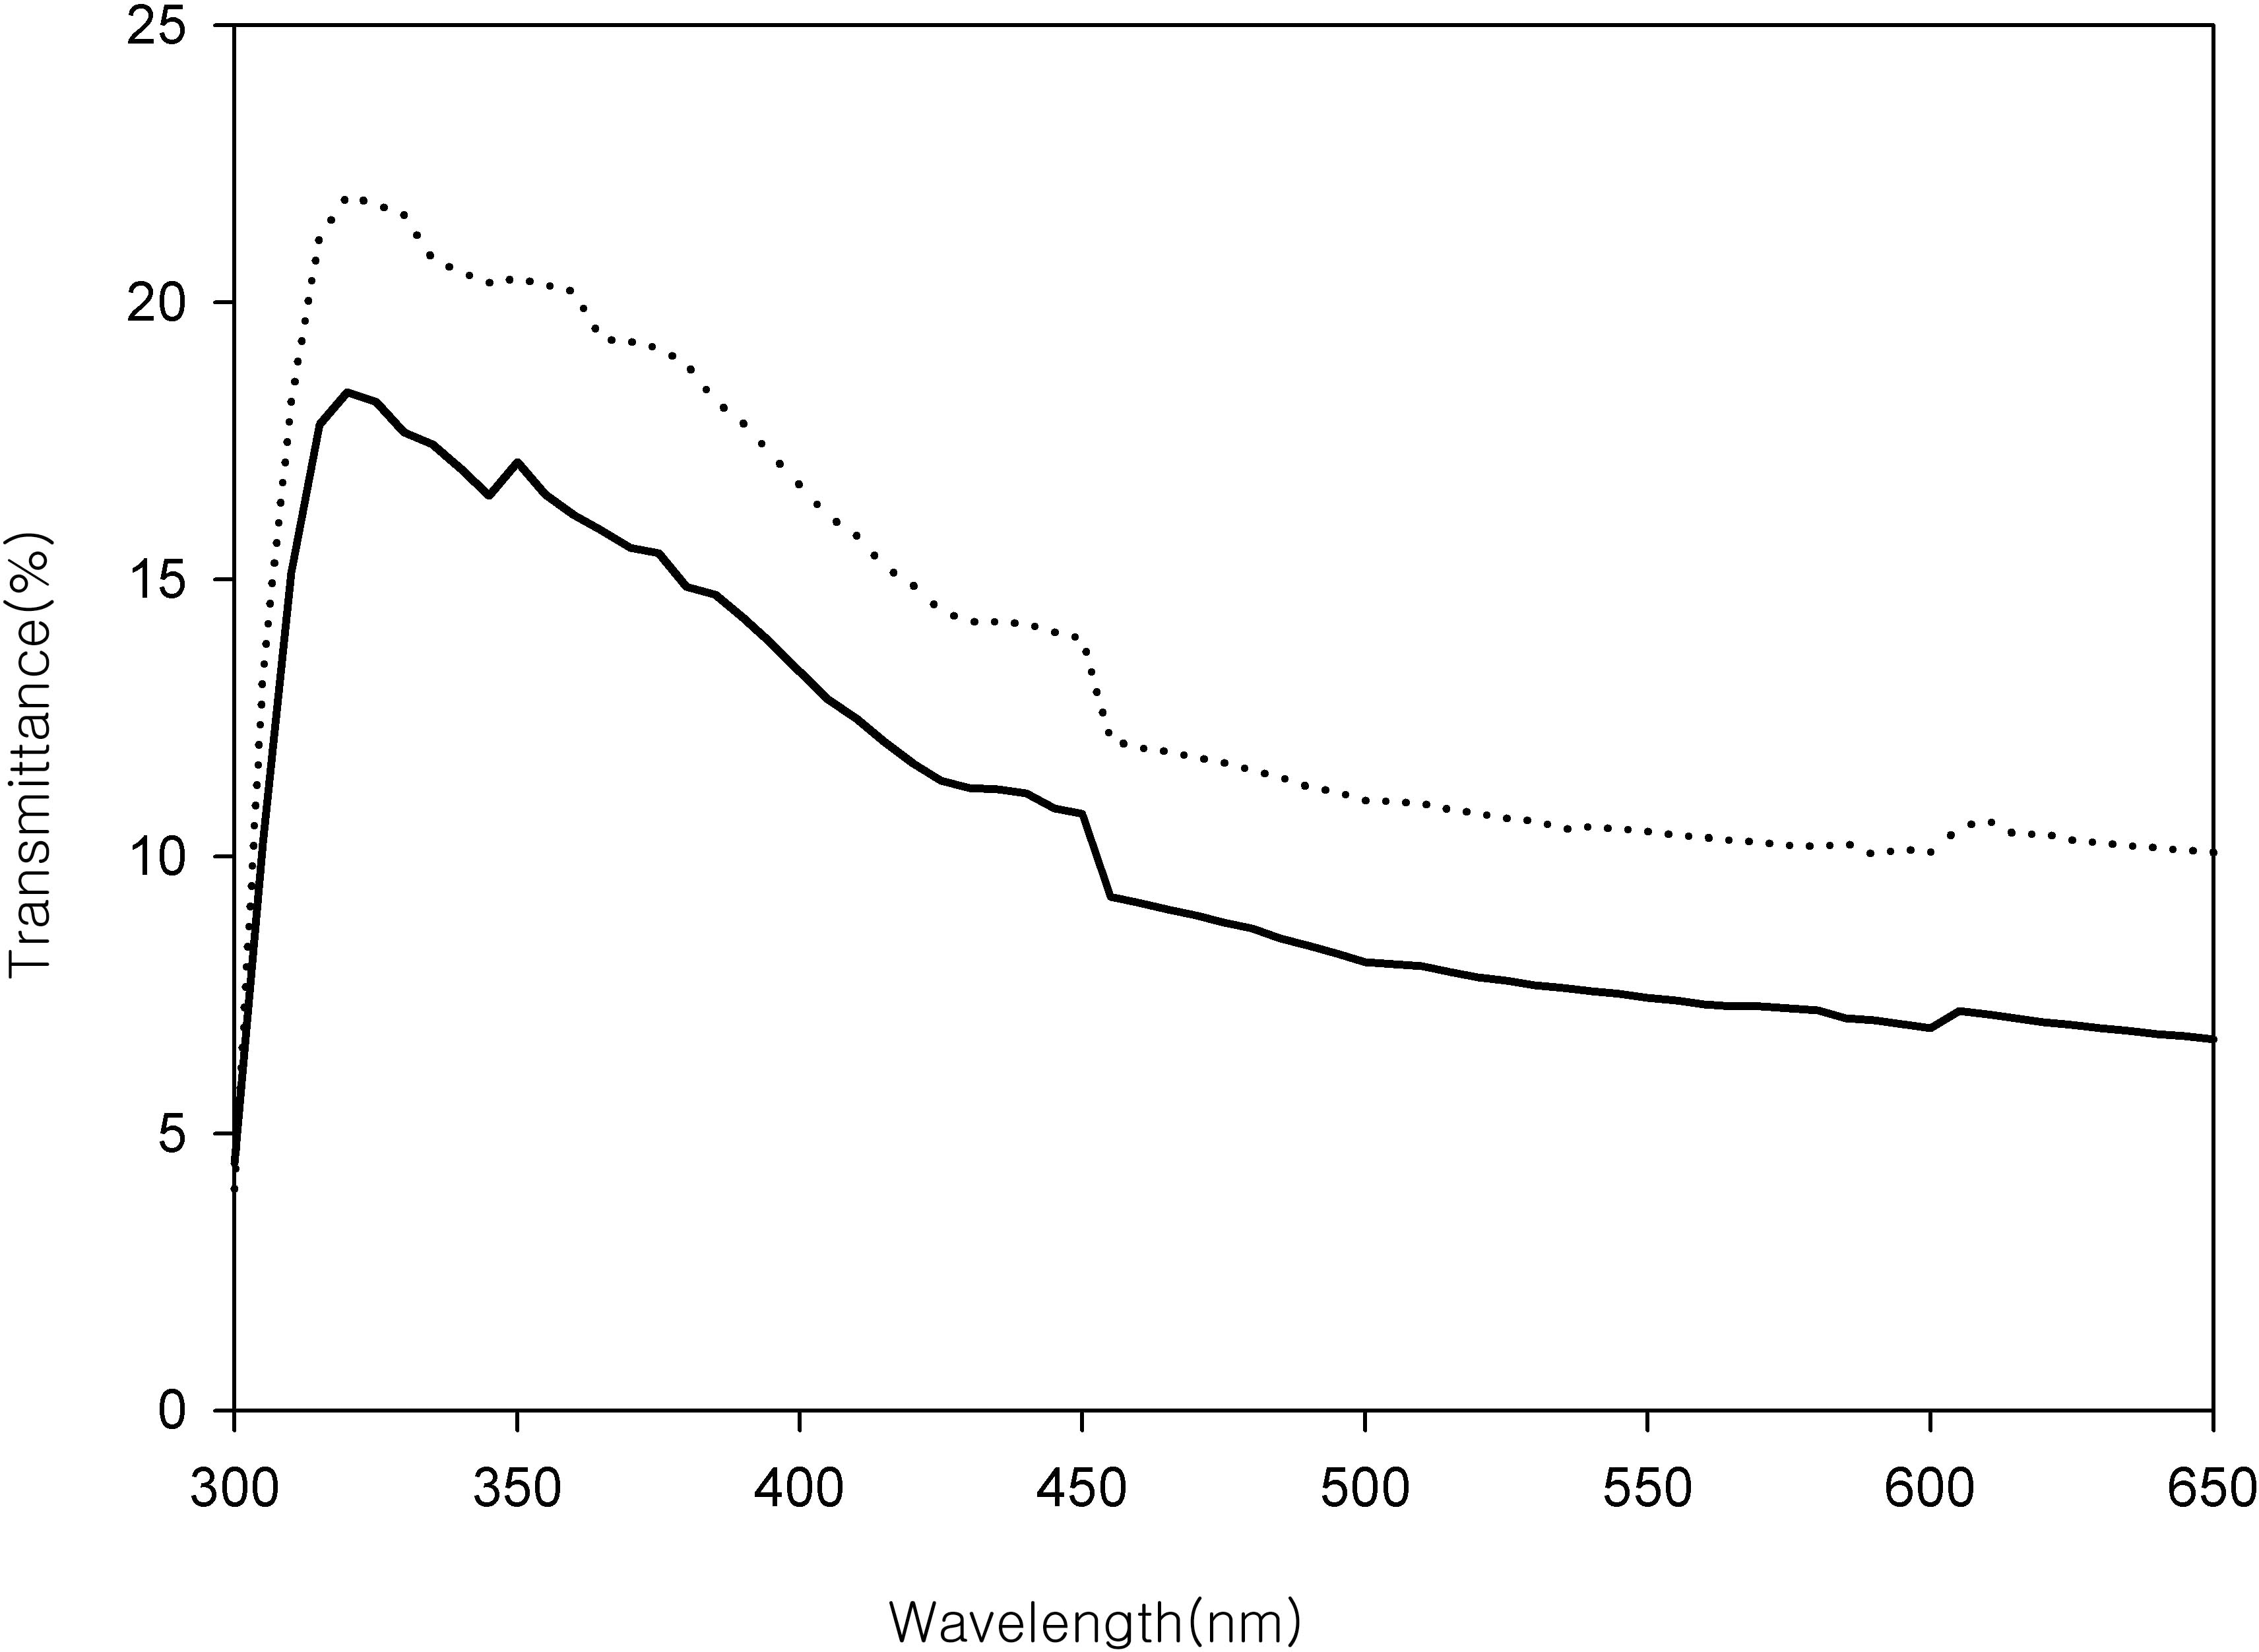
 Figure 8 of
Hwang, Mol Vis 2013; 19:2113-2123.
Figure 8 of
Hwang, Mol Vis 2013; 19:2113-2123.