Figure 6. Western blot analysis of P2X7 receptor protein levels in the whole retina after IOP elevation. A: Representative immunoreactive bands of intracellular and extracellular P2X7 receptor in the normal, the sham control, and the retina on days 1, 2, and 3 after intraocular pressure (IOP) elevation.
B: Densitometric quantification of immunoreactive bands of intracellular and extracellular P2X7 receptor in the sham control and the retina on days 1, 2, and 3 in comparison with normal retina. Data are expressed as mean±standard
deviation (SD; n=3). The asterisks indicate significant differences from the sham control eyes (unpaired Student t test, **p<0.01, *p<0.05).
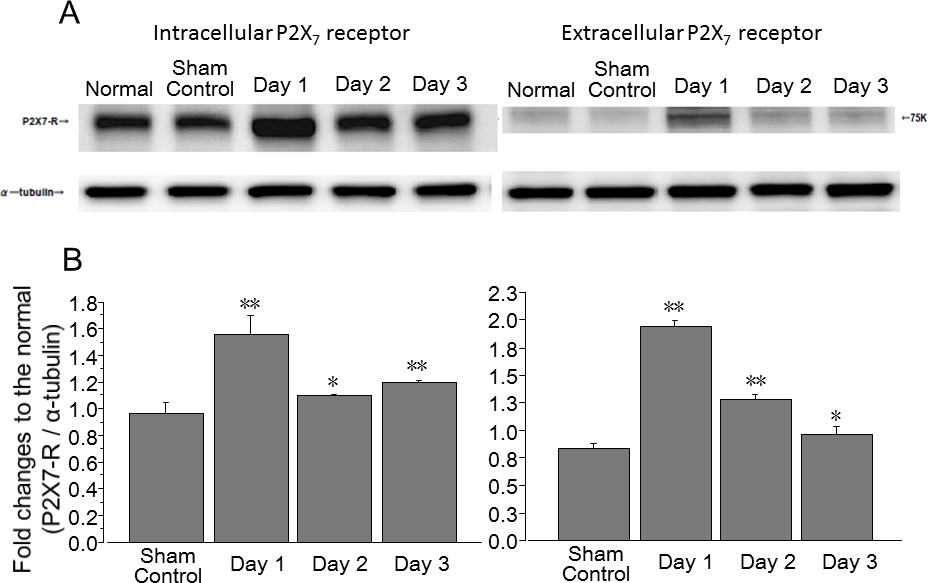
 Figure 6 of
Sugiyama, Mol Vis 2013; 19:2080-2091.
Figure 6 of
Sugiyama, Mol Vis 2013; 19:2080-2091.