Figure 6. Regression lines and values for all four mouse strains. Histogram of collagen fibril diameter density (fibers/um2) is plotted for the control mouse sclera (green line) and the glaucoma sclera (blue line) for each mouse strain. The ratio
of the glaucoma density to control density at each diameter grouping is represented as a linear regression (red line) for
each of the four mouse strains as follows: A: B6 (n=5, R2=0.01); B: CD1 (n=5, R2=0.08); C: Aca23-WT (n=5, R2=0.36), and D: Aca23 (n=5, R2=0.82). The Aca23 and CD1 glaucoma groups had a higher proportion of smaller collagen fibrils and a lower proportion of larger
fibrils compared to their controls (both p<0.0001).
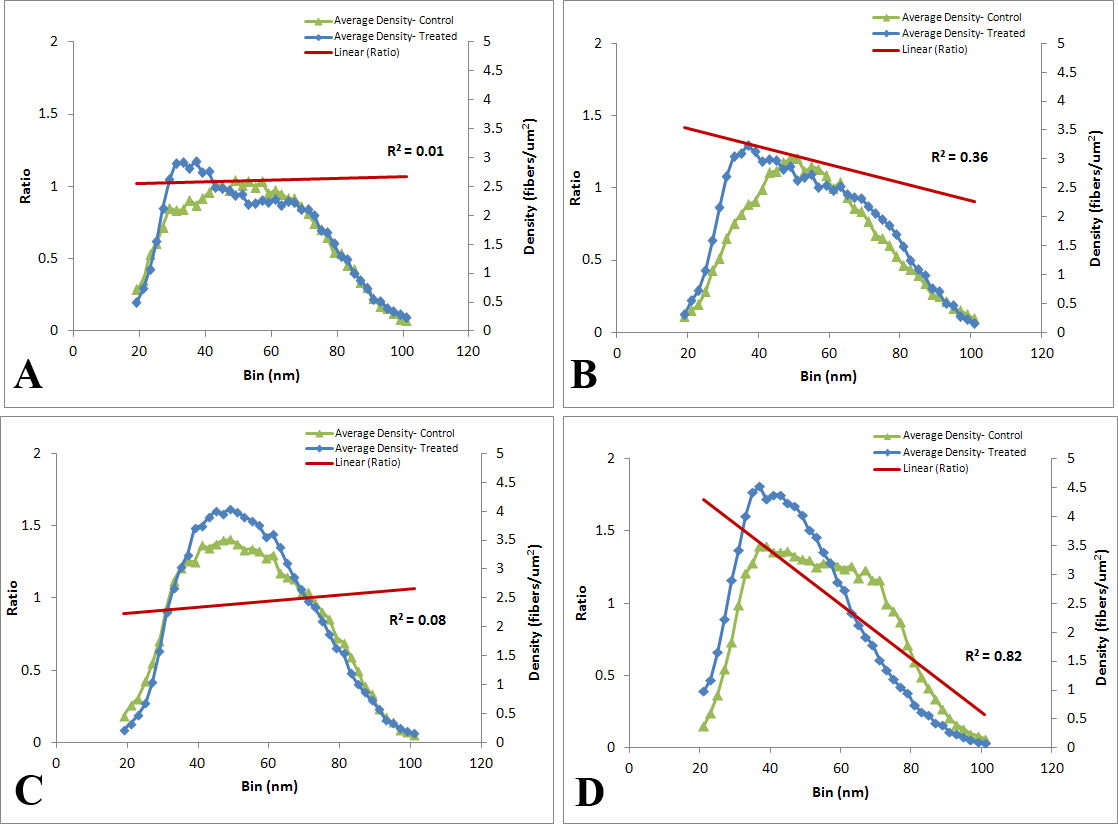
 Figure 6 of
Cone-Kimball, Mol Vis 2013; 19:2023-2039.
Figure 6 of
Cone-Kimball, Mol Vis 2013; 19:2023-2039.