Figure 1. Mean intraocular pressure in control and glaucoma groups by strain. The mean intraocular pressure (IOP; mmHg) readings of
the control eye and glaucoma treated eyes at five different time points post bead injection are shown in the panels as follows:
A: B6, n=5; B: CD1, n=5; C: Aca23-WT, n=5; and D: Aca23, n=5.
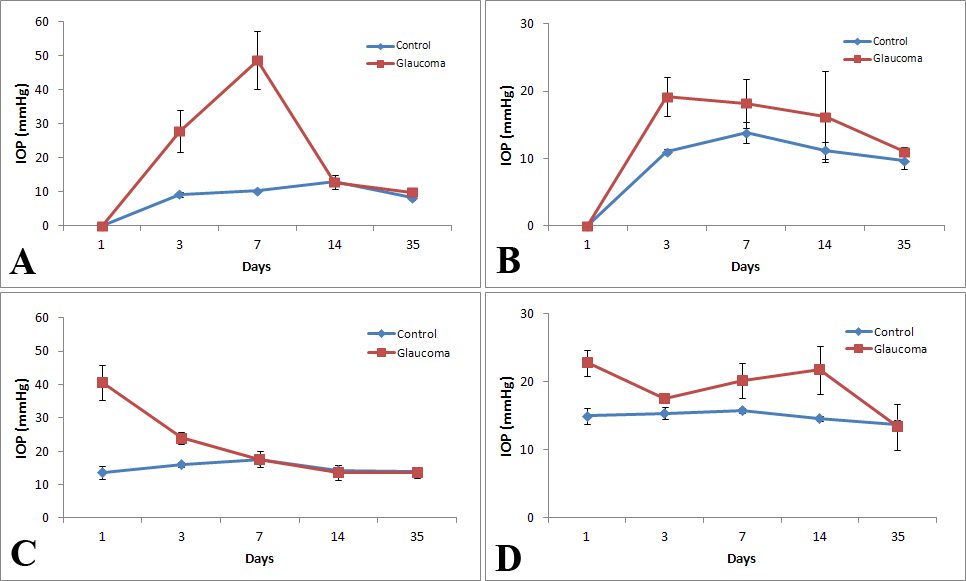
 Figure 1 of
Cone-Kimball, Mol Vis 2013; 19:2023-2039.
Figure 1 of
Cone-Kimball, Mol Vis 2013; 19:2023-2039.