 Appendix 2 of
Cone-Kimball, Mol Vis 2013; 19:2023-2039.
Appendix 2 of
Cone-Kimball, Mol Vis 2013; 19:2023-2039. Appendix 2 of
Cone-Kimball, Mol Vis 2013; 19:2023-2039.
Appendix 2.
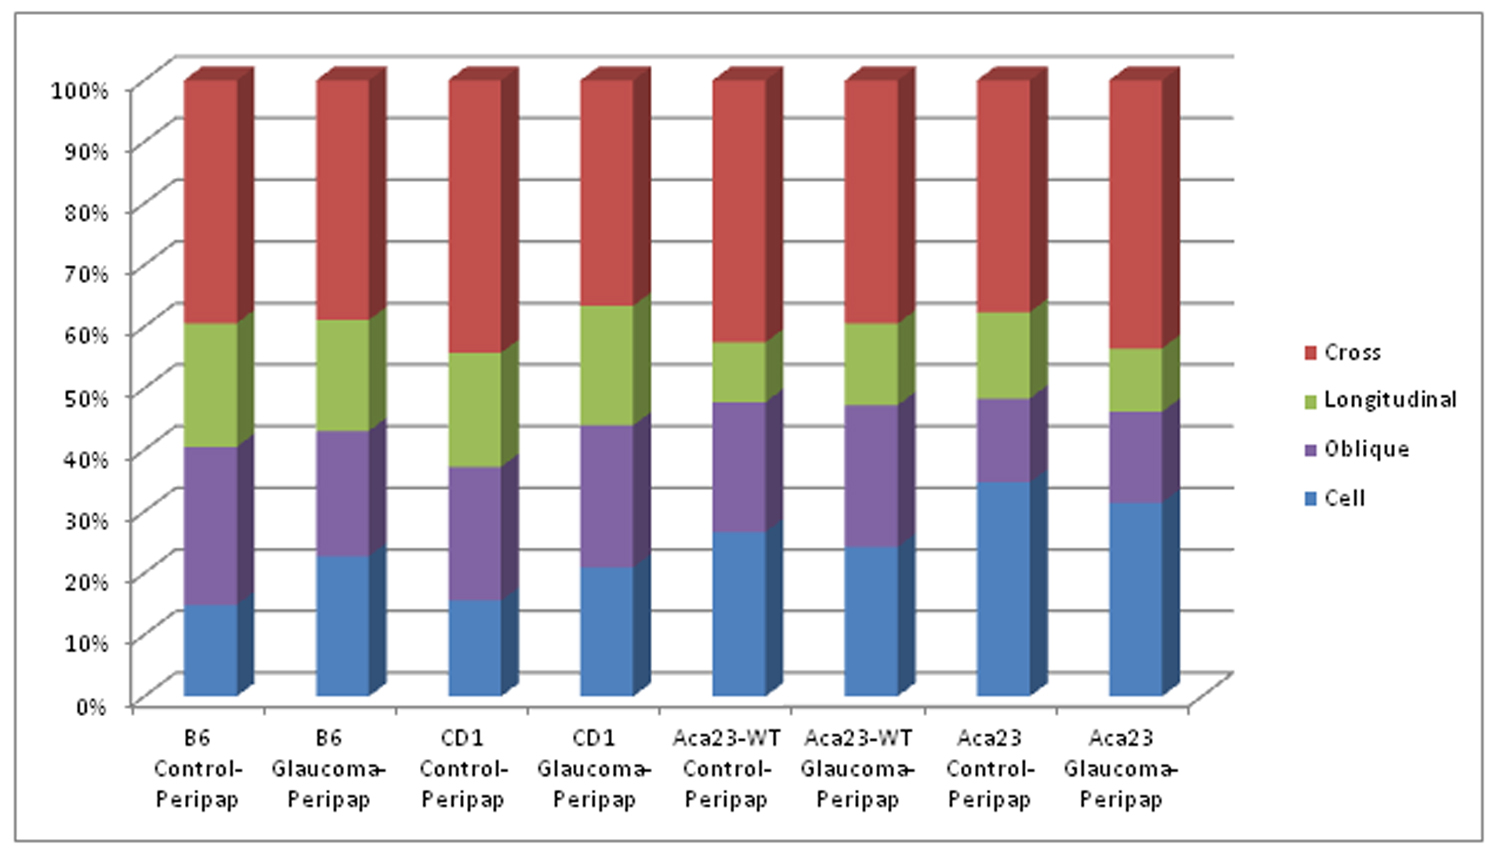
Orientation/ cellular component percent represented To access the data, click or select the words “Appendix 2.” Stacked columns represent the percent each orientation/ cellular component makes up for a given mouse strain and treatment group, in the peripapillary area. Fibrils in cross section are represented in red, those in longitudinal orientation are represented in green, fibrils in an oblique angle are represented in purple and cellular components are in blue