Figure 6. Effect of total flavonoids from Flos Puerariae (TFF) on Bax and Bcl-2 expression in retinas of the diabetic mice. A: The photomicrographs were representatives the retina sections immunohistochemistry stained with Bax and Bcl-2 antibody.
n=4 per group. (Magnification: 400×). Bax and Bcl-2 expression were localized in the cytosol of cells mainly in ganglion cell
layer (GCL) and inner nuclear layer (INL). B: The photographs were representatives the western blot of Bax and Bcl-2 protein. Five western blots per group were experimented.
C: Relative intensities of Bax protein (fold to β-actin). D: Relative intensities of Bcl-2 protein (fold to β-actin). E: Ratio of the relative intensities of Bcl-2 to Bax (Bcl-2 / Bax). Data are expressed as mean ±standard deviation. *p<0.01.
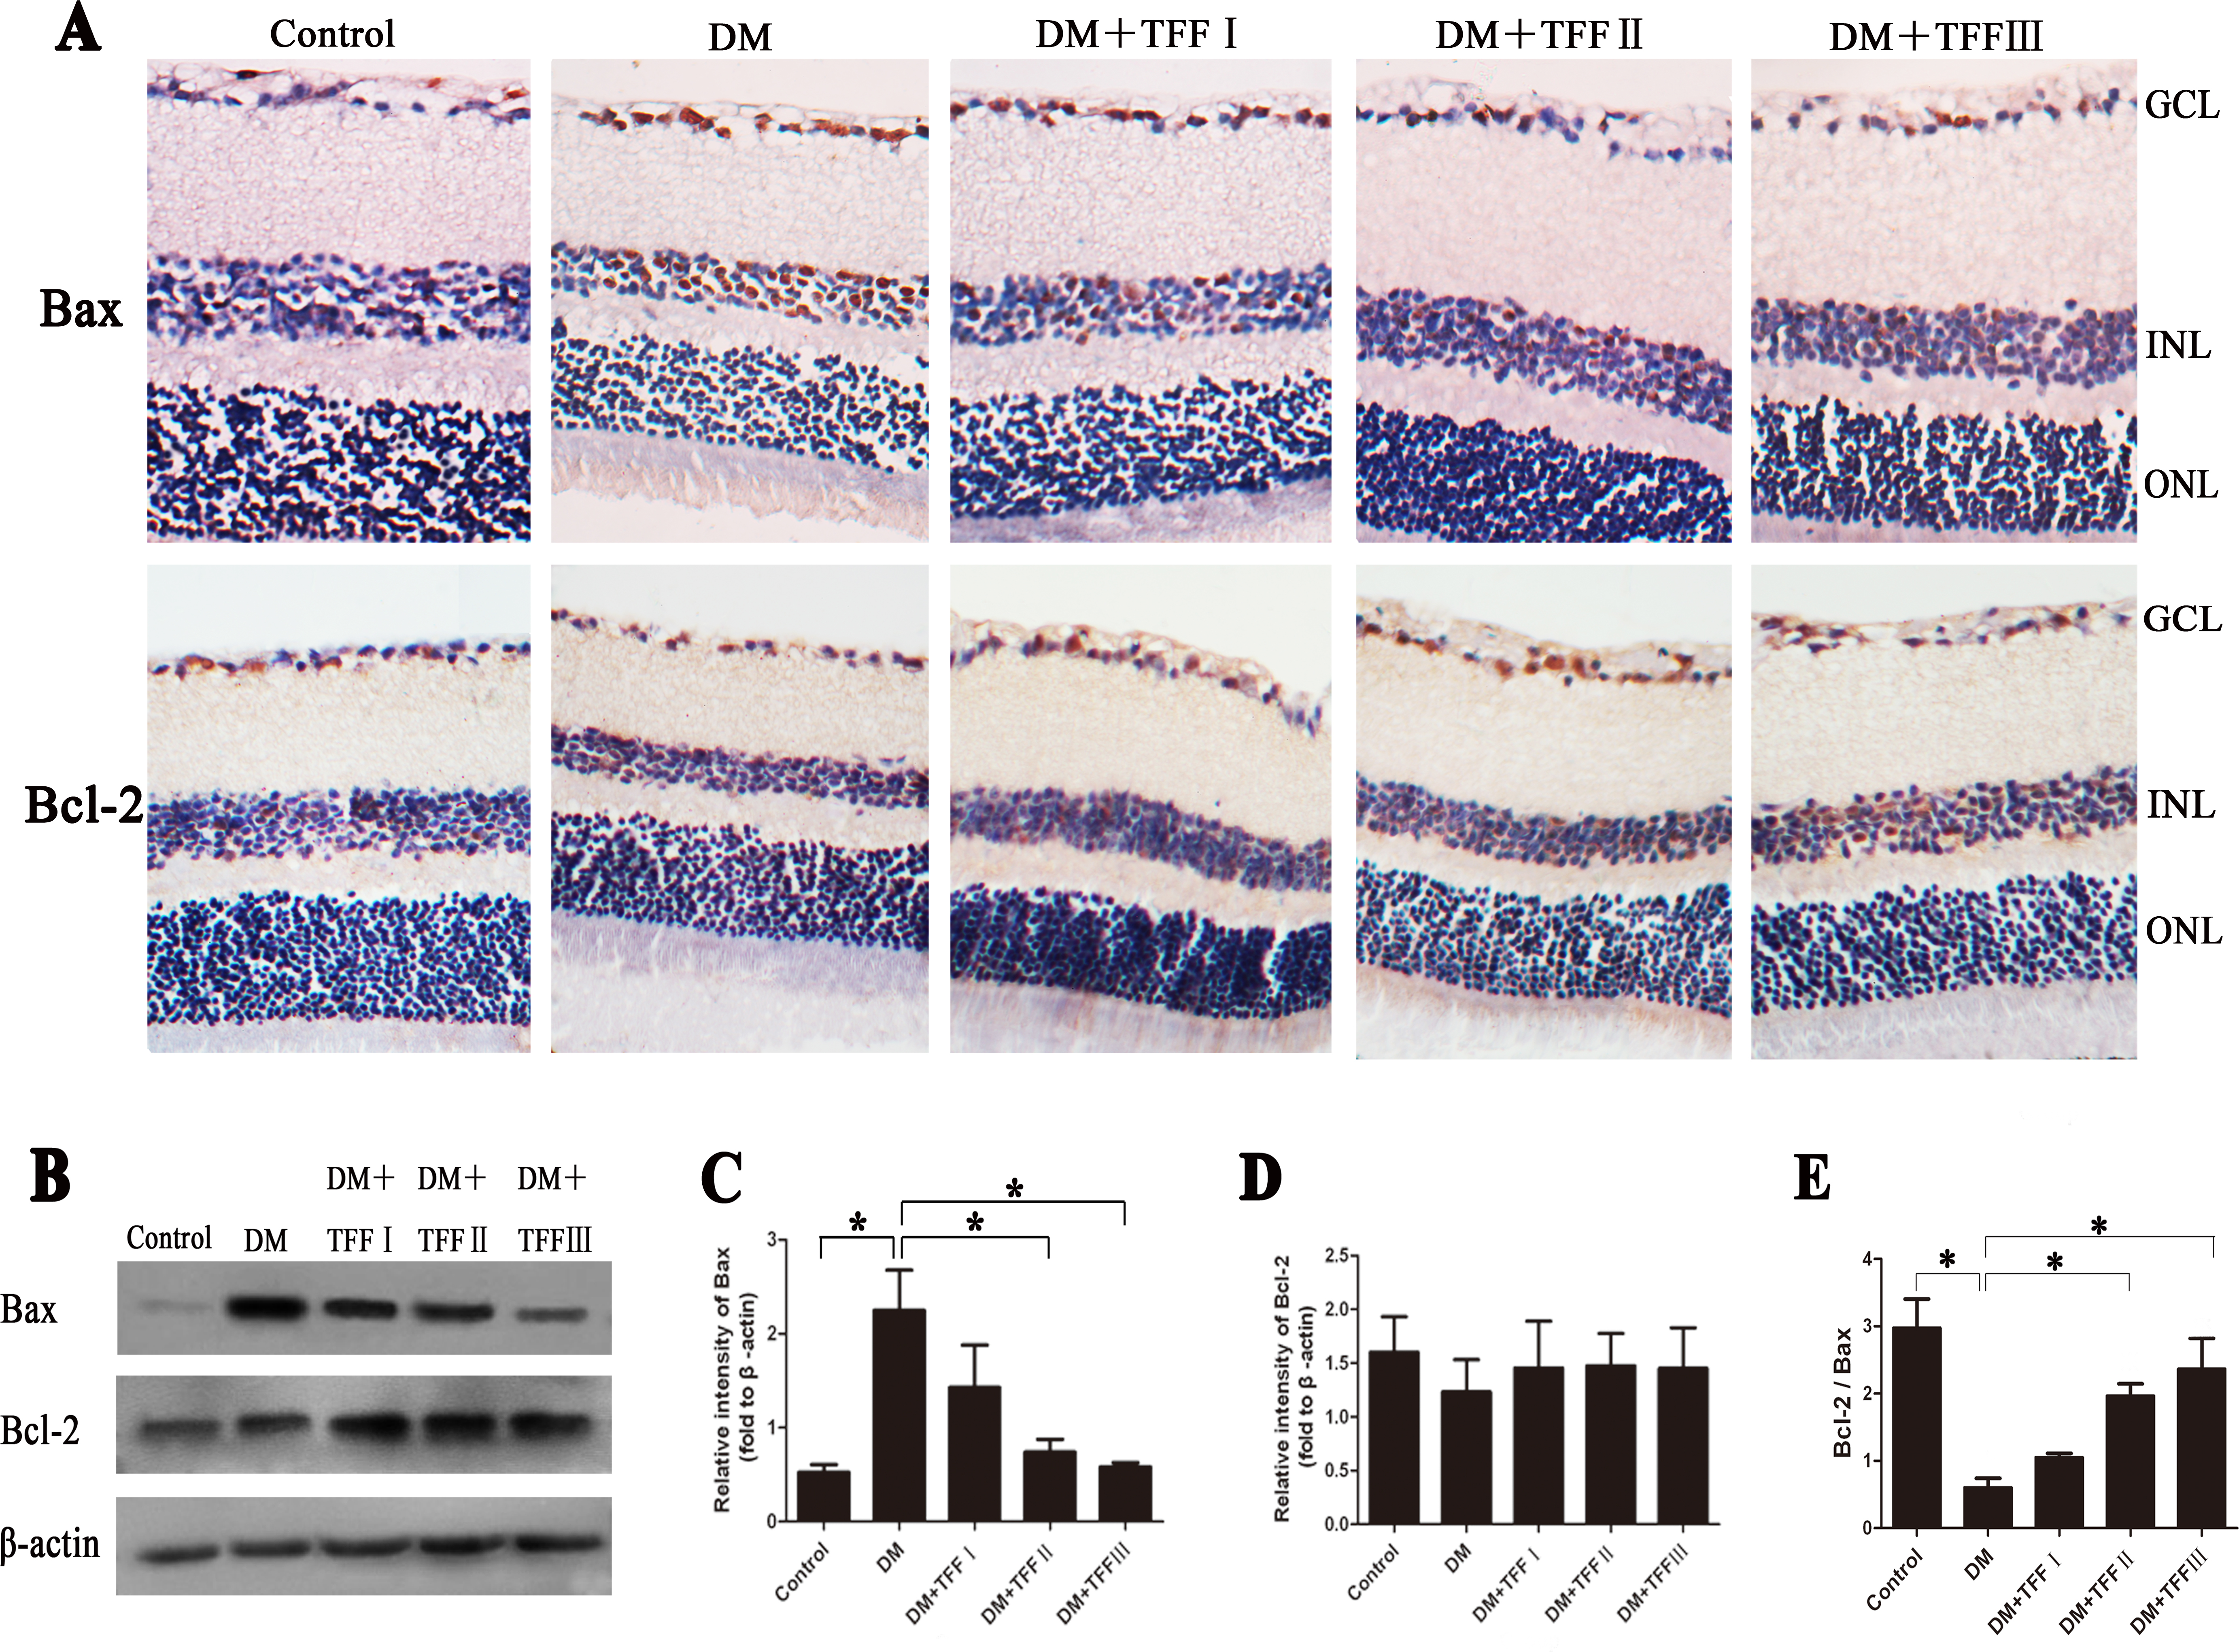
 Figure 6 of
Li, Mol Vis 2013; 19:1999-2010.
Figure 6 of
Li, Mol Vis 2013; 19:1999-2010.