Figure 3. Representative changes in cell shape and relative mobility of primary trabecular meshwork cells on exposure to Cer(d18:0/18:1(9Z)).
Approximately 5,000 primary trabecular meshwork (TM) cells were plated in the individuals wells of a 24 well plate and subjected
to treatment with vehicle (10% dimethyl sulfoxide [DMSO]) or 20 pmol of Cer(d18:0/18:1(9Z)). Viability of cells was determined
using a Trypan blue exclusion assay. A: Representative of control vehicle only–treated TM cells. B: Representative of TM cells treated with lipid in the same vehicle. C-D: Representative of control vehicle only–treated TM cells imaged between 5 and 20 min, as indicated. The arrowhead indicates
a cell in the middle whose mobility is estimated relative to other surrounding cells. E-J: Representative of TM cells treated in vehicle between 5 and 20 min, as indicated. Arrows show movement of cells relative
to adjacent cells. K: The relative mobility of cells expressed in arbitrary units sampled from five different regions of the video images. The
mobility was estimated by three independent observers from the same video. Average data from 10 independent video images (Appendix
3 and Appendix 4) and standard error of the mean have been presented.
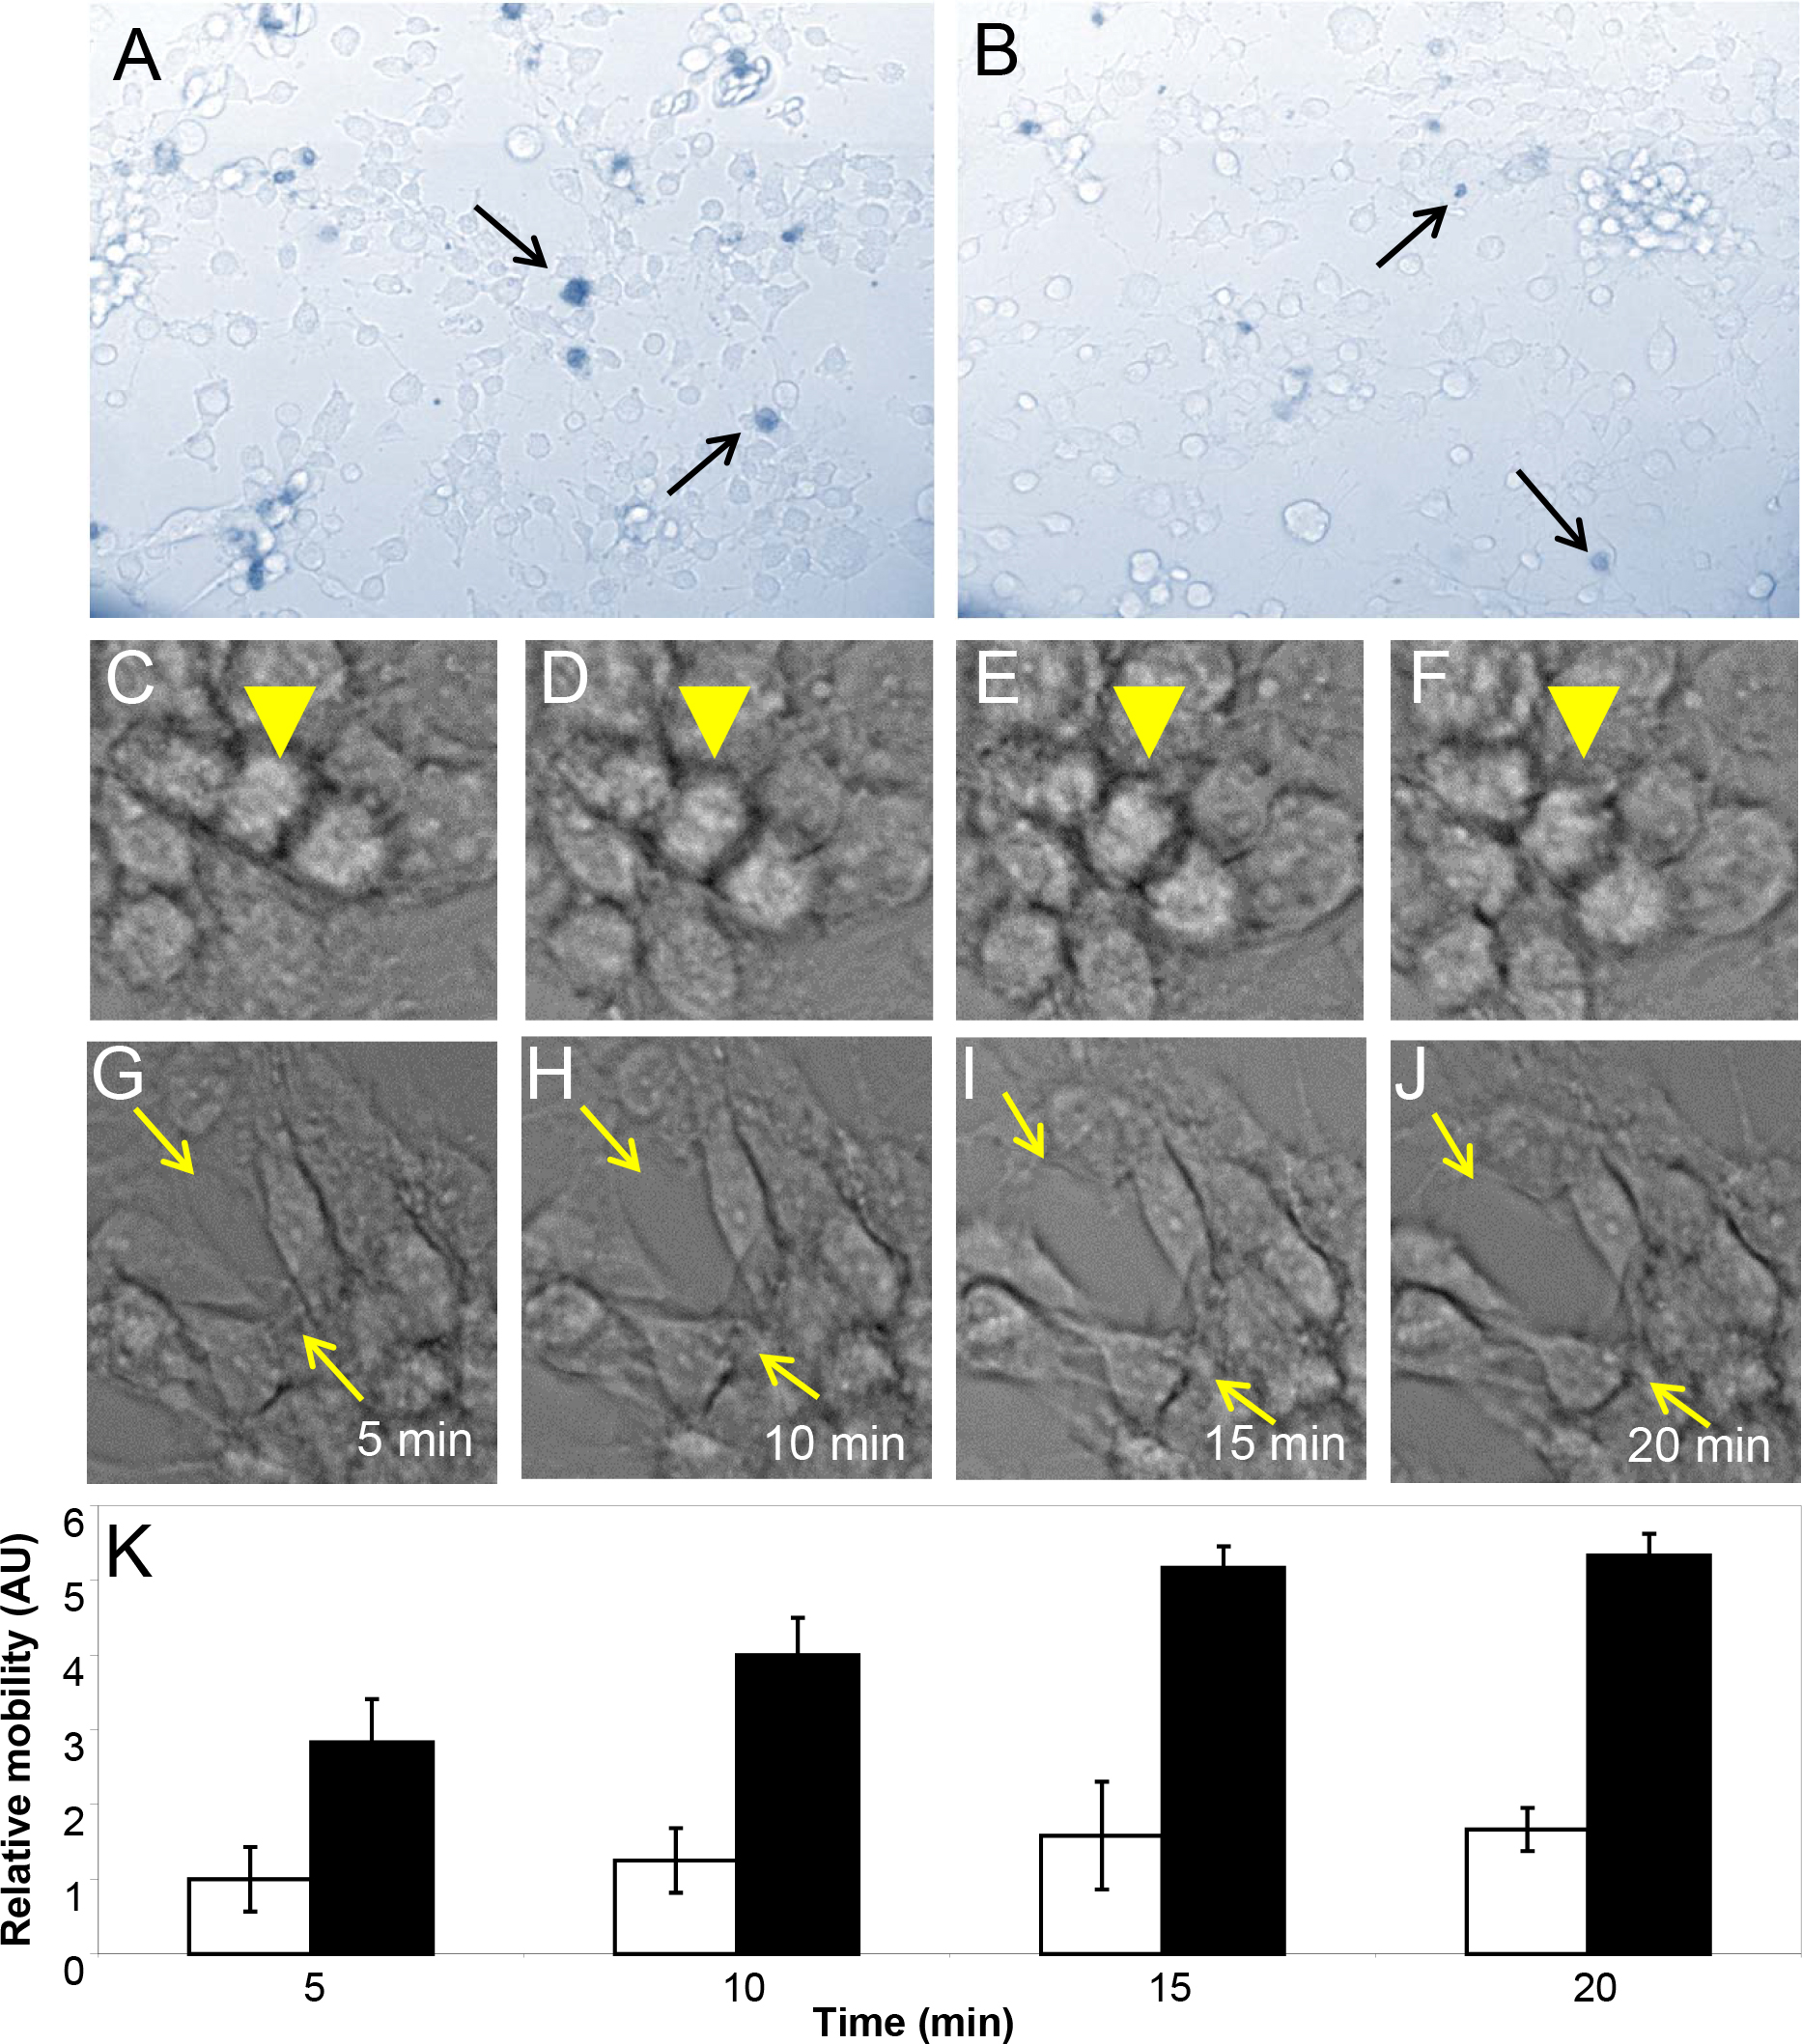
 Figure 3 of
Aljohani, Mol Vis 2013; 19:1966-1984.
Figure 3 of
Aljohani, Mol Vis 2013; 19:1966-1984.