Figure 2. Schematic diagram of sphingolipids and ceramides showing precursor and product ions. A: This panel illustrates the structure of sphingomyelin standard with an m/z ratio of 728.6; the product ions can be generated
in neutral loss scan (NLS) mode (m/z=212.3) or precursor ion scan (PIS) mode (m/z=184.07), as shown. B: The structure of the sphingoid base standard with an m/z ratio of 299.3 is depicted; the product ion is generated in NLS
(product ion=48) as shown. C: The structure of the sphingosine-1-phosphate standard with an m/z ratio of 379.3 is depicted; the product ion is generated
in PIS (product ion=79.1), as shown. D: The structure of the ceramide standard with an m/z ratio of 563.6 is depicted; the product ion is generated in NLS (m/z=254.3),
as shown.
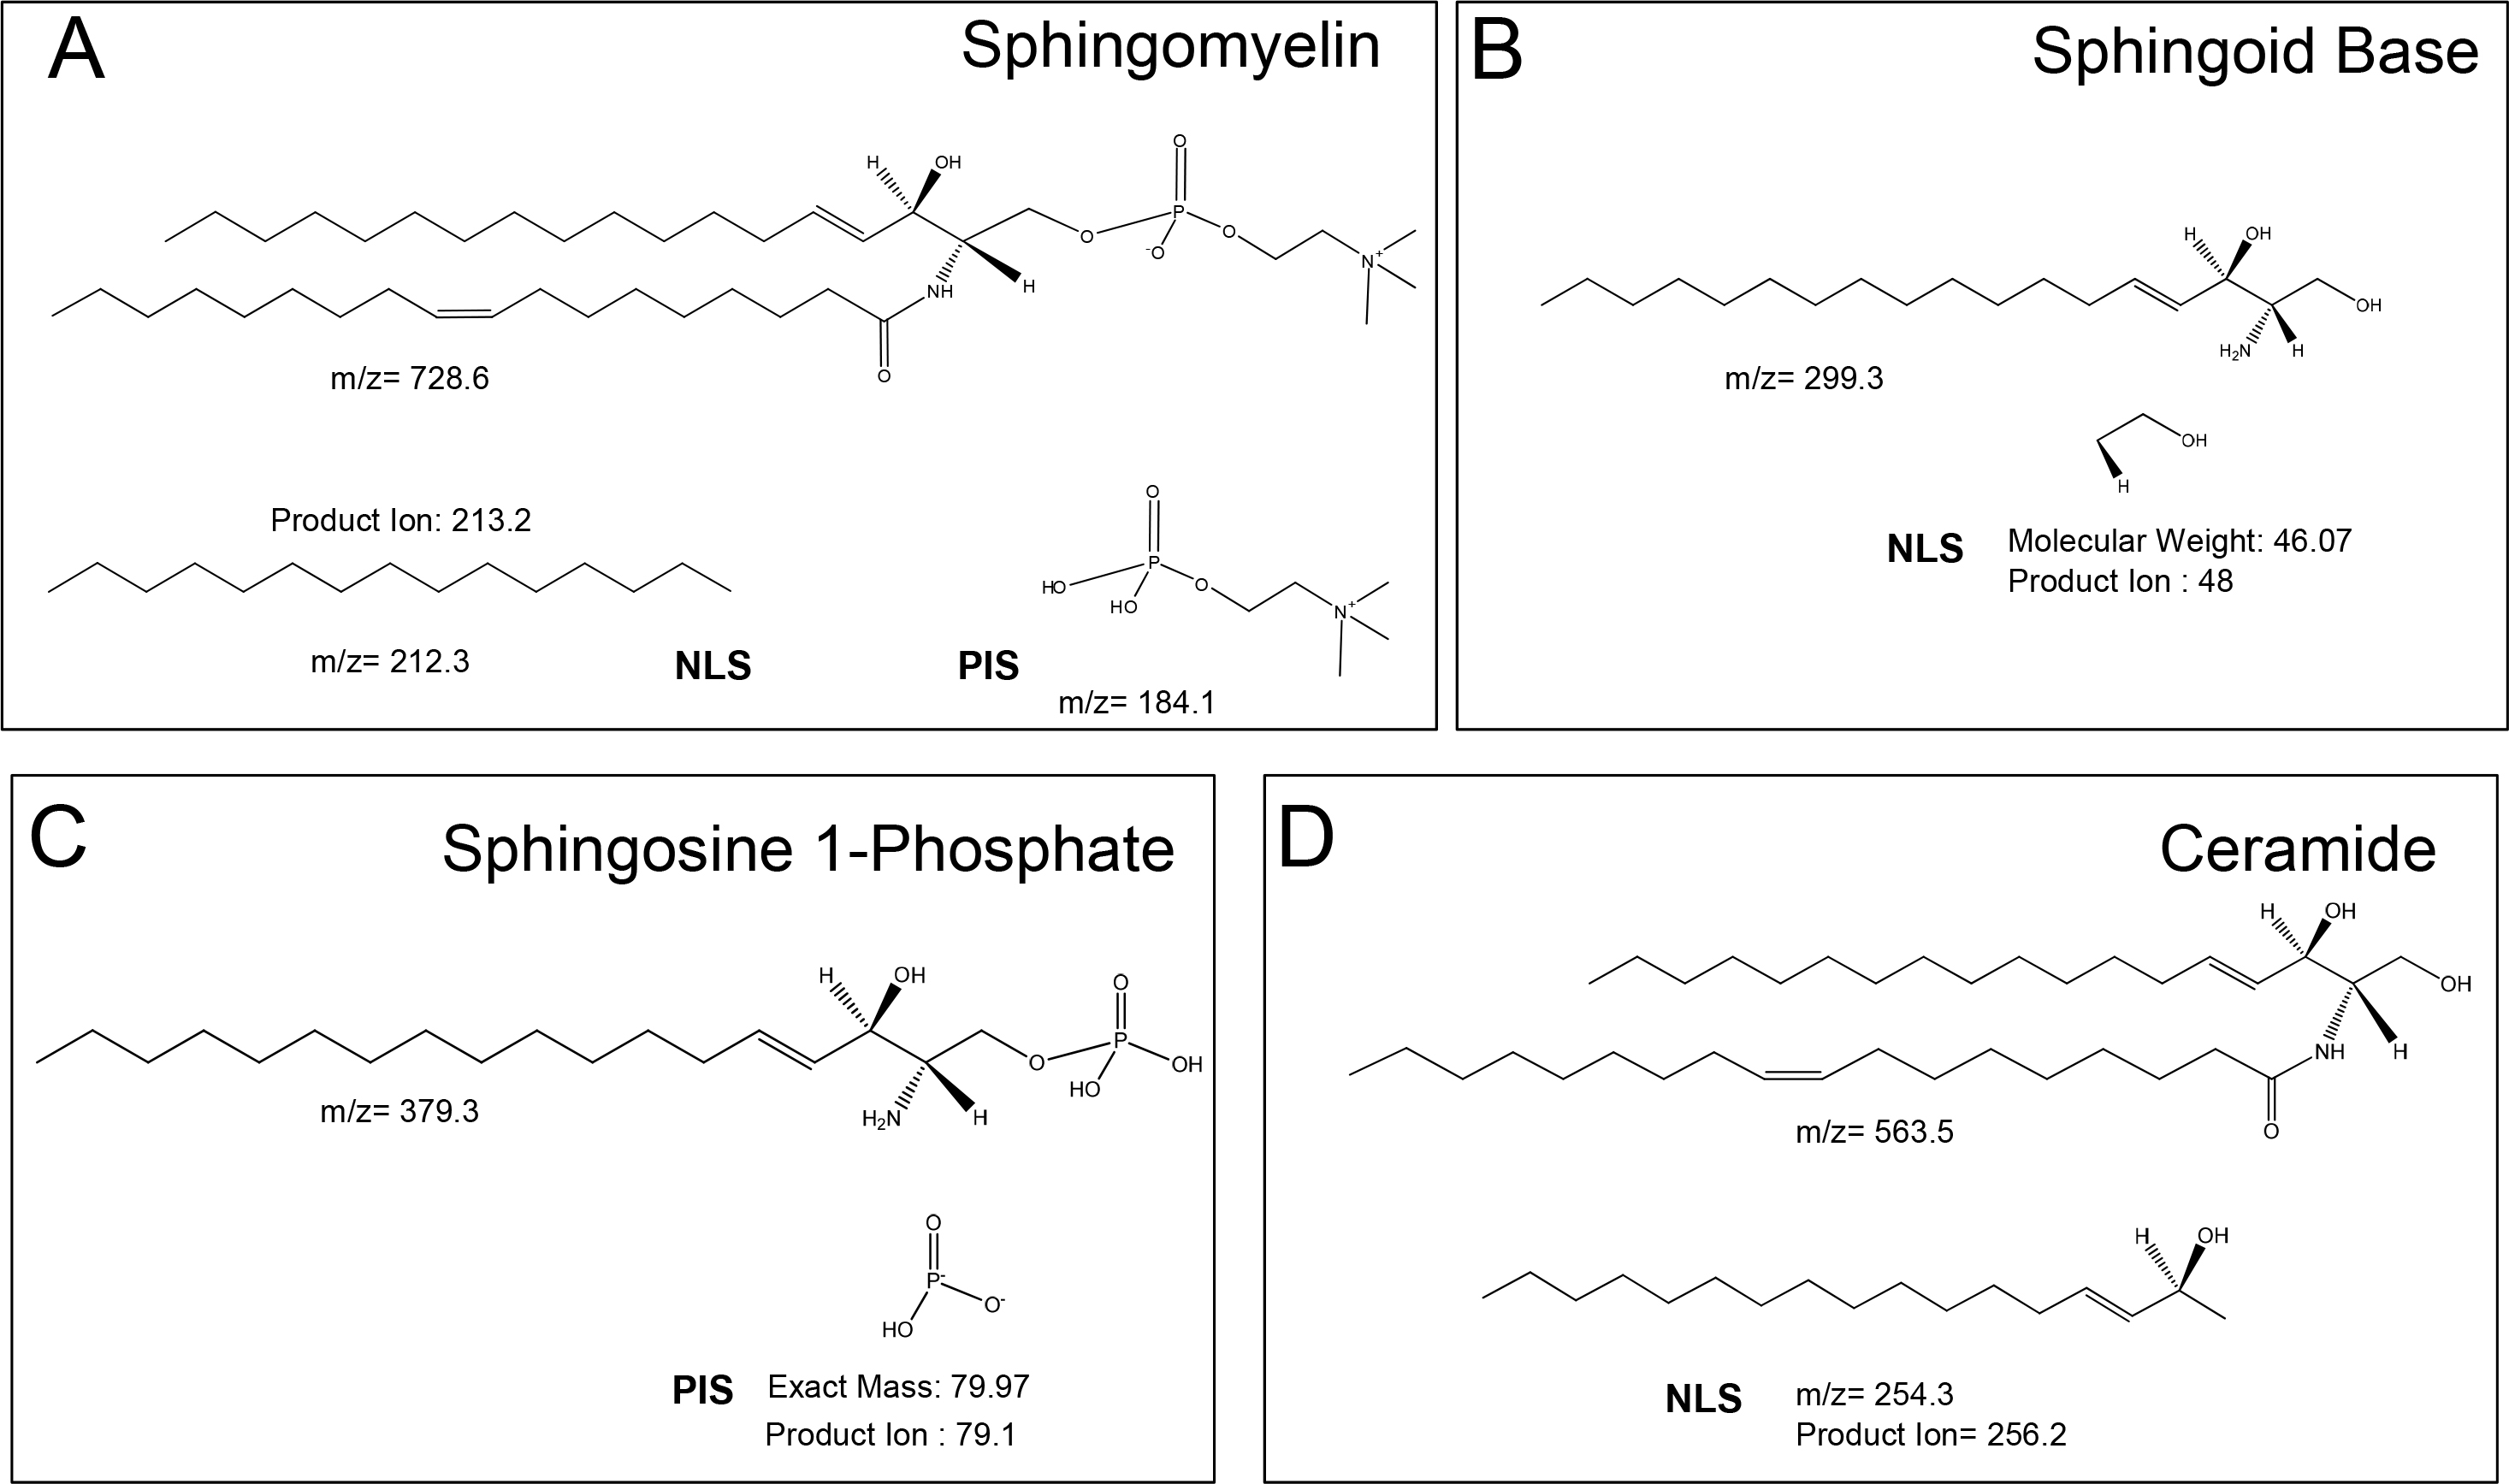
 Figure 2 of
Aljohani, Mol Vis 2013; 19:1966-1984.
Figure 2 of
Aljohani, Mol Vis 2013; 19:1966-1984.