Figure 5. Flow cytometry evaluation of human corneal-limbal epithelial (HCLE) cell volume changes in response to isotonic (300 mOsm)
medium or hyperosmotic medium (500 mOsm) with or without the presence of L-carnitine or D-carnitine (10 mM). A: Representative dot plots, (a) population of healthy cells and (b) population of shrunken cells, are shown. B: Percentage number of healthy and shrunken HCLE cells is shown. Data represent the mean±SD of eight samples. * shows the
significant difference in the percentage number of shrunken cells between 500 mOsm and 500 mOsm + L-carnitine or isotonic
(300 mOsm).
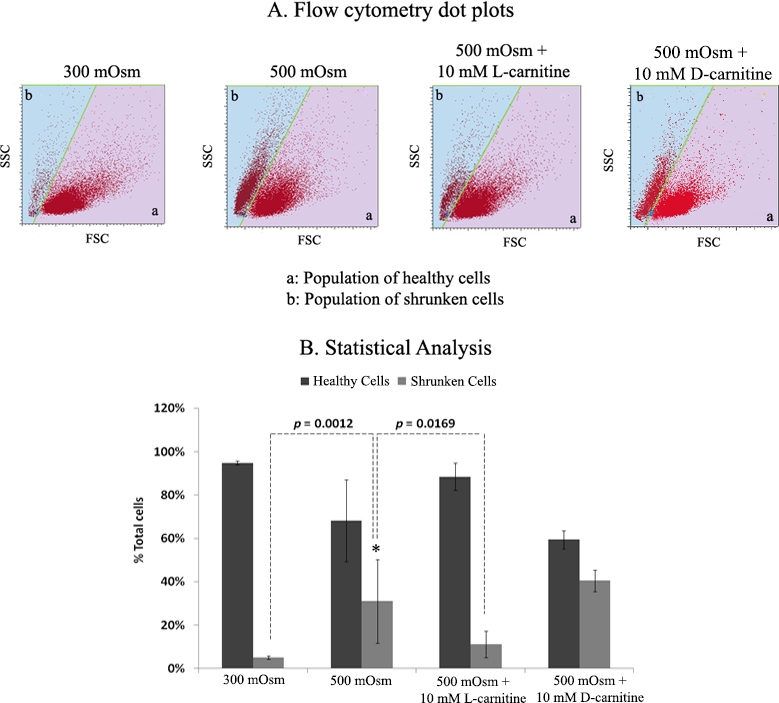
 Figure 5 of
Khandekar, Mol Vis 2013; 19:1945-1956.
Figure 5 of
Khandekar, Mol Vis 2013; 19:1945-1956.