Figure 4. Flow cytometry analysis of the physiologic state of cells in response to isotonic (300 mOsm) media or hyperosmotic stress
(500 mOsm) in the presence or absence of L-carnitine or D-carnitine (10 mM). A: Representative flow cytometry dot plots are shown. Quadrant ‘a'=the population of viable healthy cells that stained with
neither propidium iodide (PI) nor annexin V. Quadrant ‘b’=the population of cells staining with annexin V but not PI, indicating
an early apoptotic population. Quadrant ‘c’=the population of cells stained with annexin V and PI, indicating a late apoptotic
population. Quadrant ‘d’=the population of cells staining positive for PI but not annexin V, indicating the complete loss
of the cell membrane and thus representing necrotic cells. B: Statistical analysis of percentage of healthy and damaged/dead HCLE cells is shown. Data represent the mean±SD of eight
samples. * represents the statistically significant difference between 500 mOsm and 500 mOsm + L-carnitine or isotonic (300
mOsm).
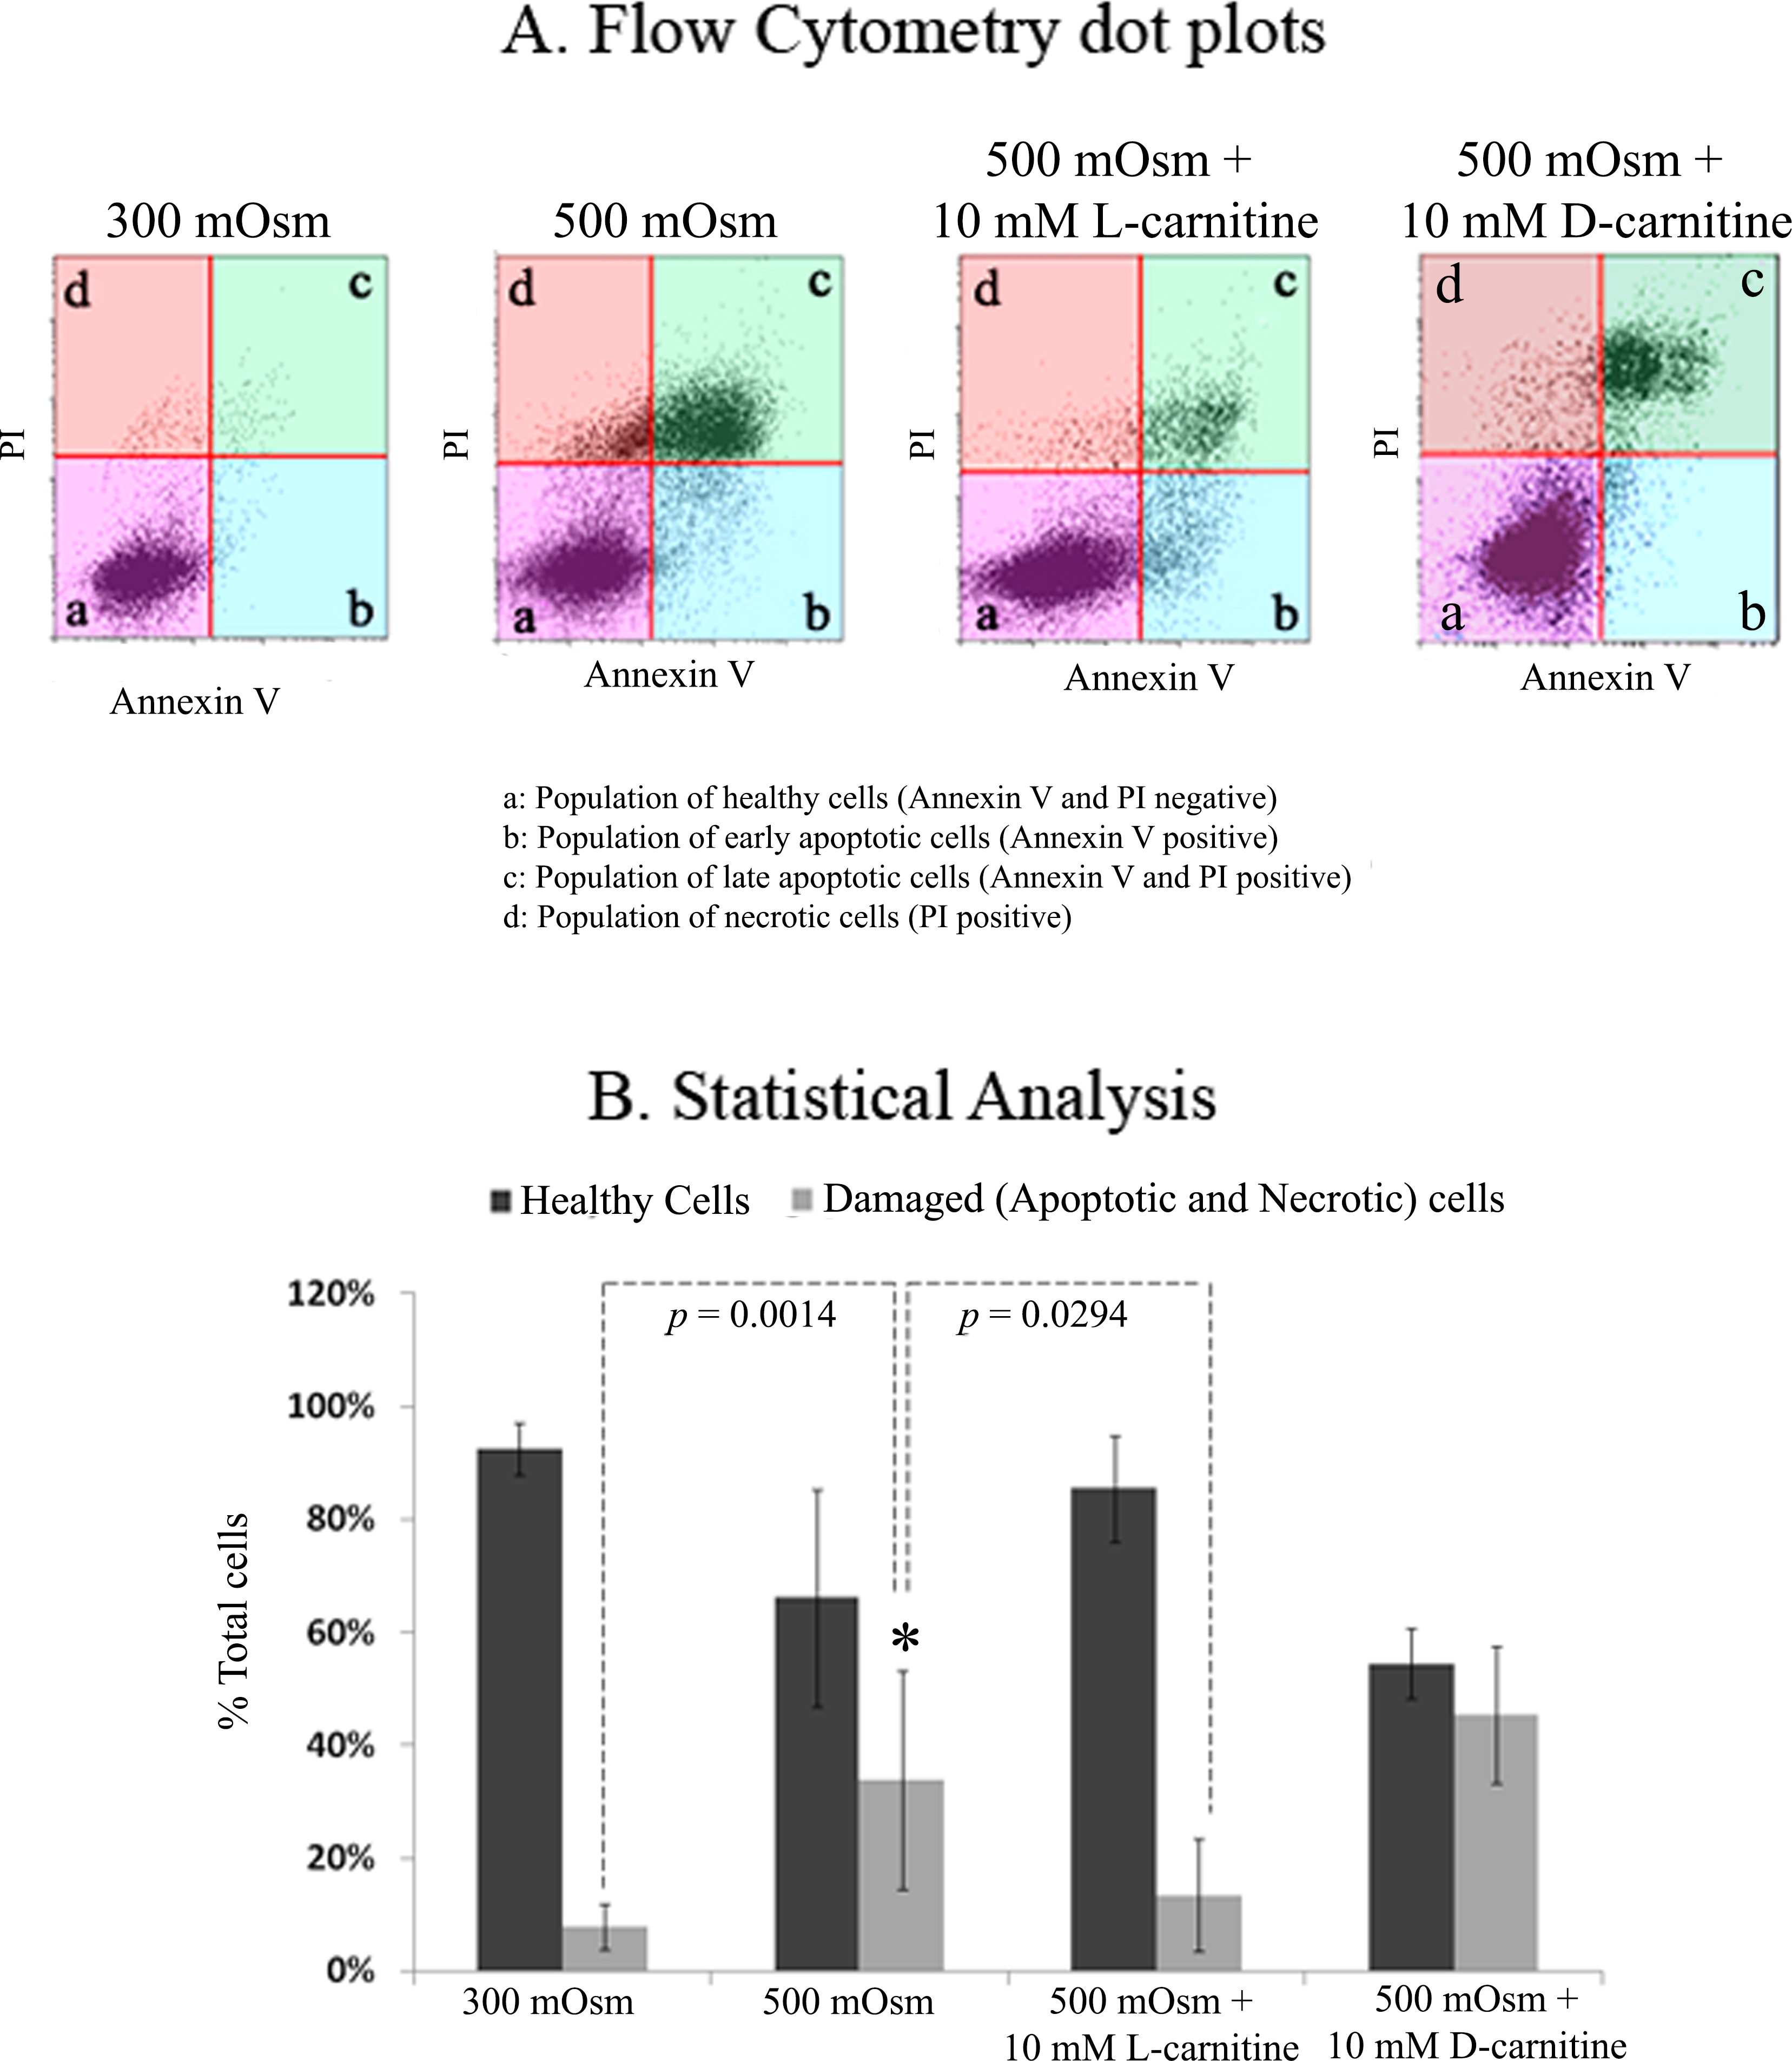
 Figure 4 of
Khandekar, Mol Vis 2013; 19:1945-1956.
Figure 4 of
Khandekar, Mol Vis 2013; 19:1945-1956.