Figure 3. Confocal microscopic evaluation of hyperosmotic stress in the presence of 10 mM L-carnitine on the physiological state of
HCLE cells. Representative images of HCLE cells stained with Hoechst (blue), annexin V (green) and PI (red) after 16 h exposure
to 300 mOsm (A), 50 mOsm (B) or 500 mOsm+10 mM L-carnitine (C) media are shown. These images were acquired under the normal culture condition for HCLE with Ca2+ concentration of 0.4 mM.The percentage of healthy and damaged/dead HCLE cells under the Ca2+ concentration of 0.4 mM (D) or 1.0 mM (E) is shown. * and # represents a statistically significant difference between 500 mOsm and 500 mOsm+L-carnitine or isotonic (300 mOsm) conditions
with Ca2+ concentration of 0.4 and 1.0 mM, respectively.
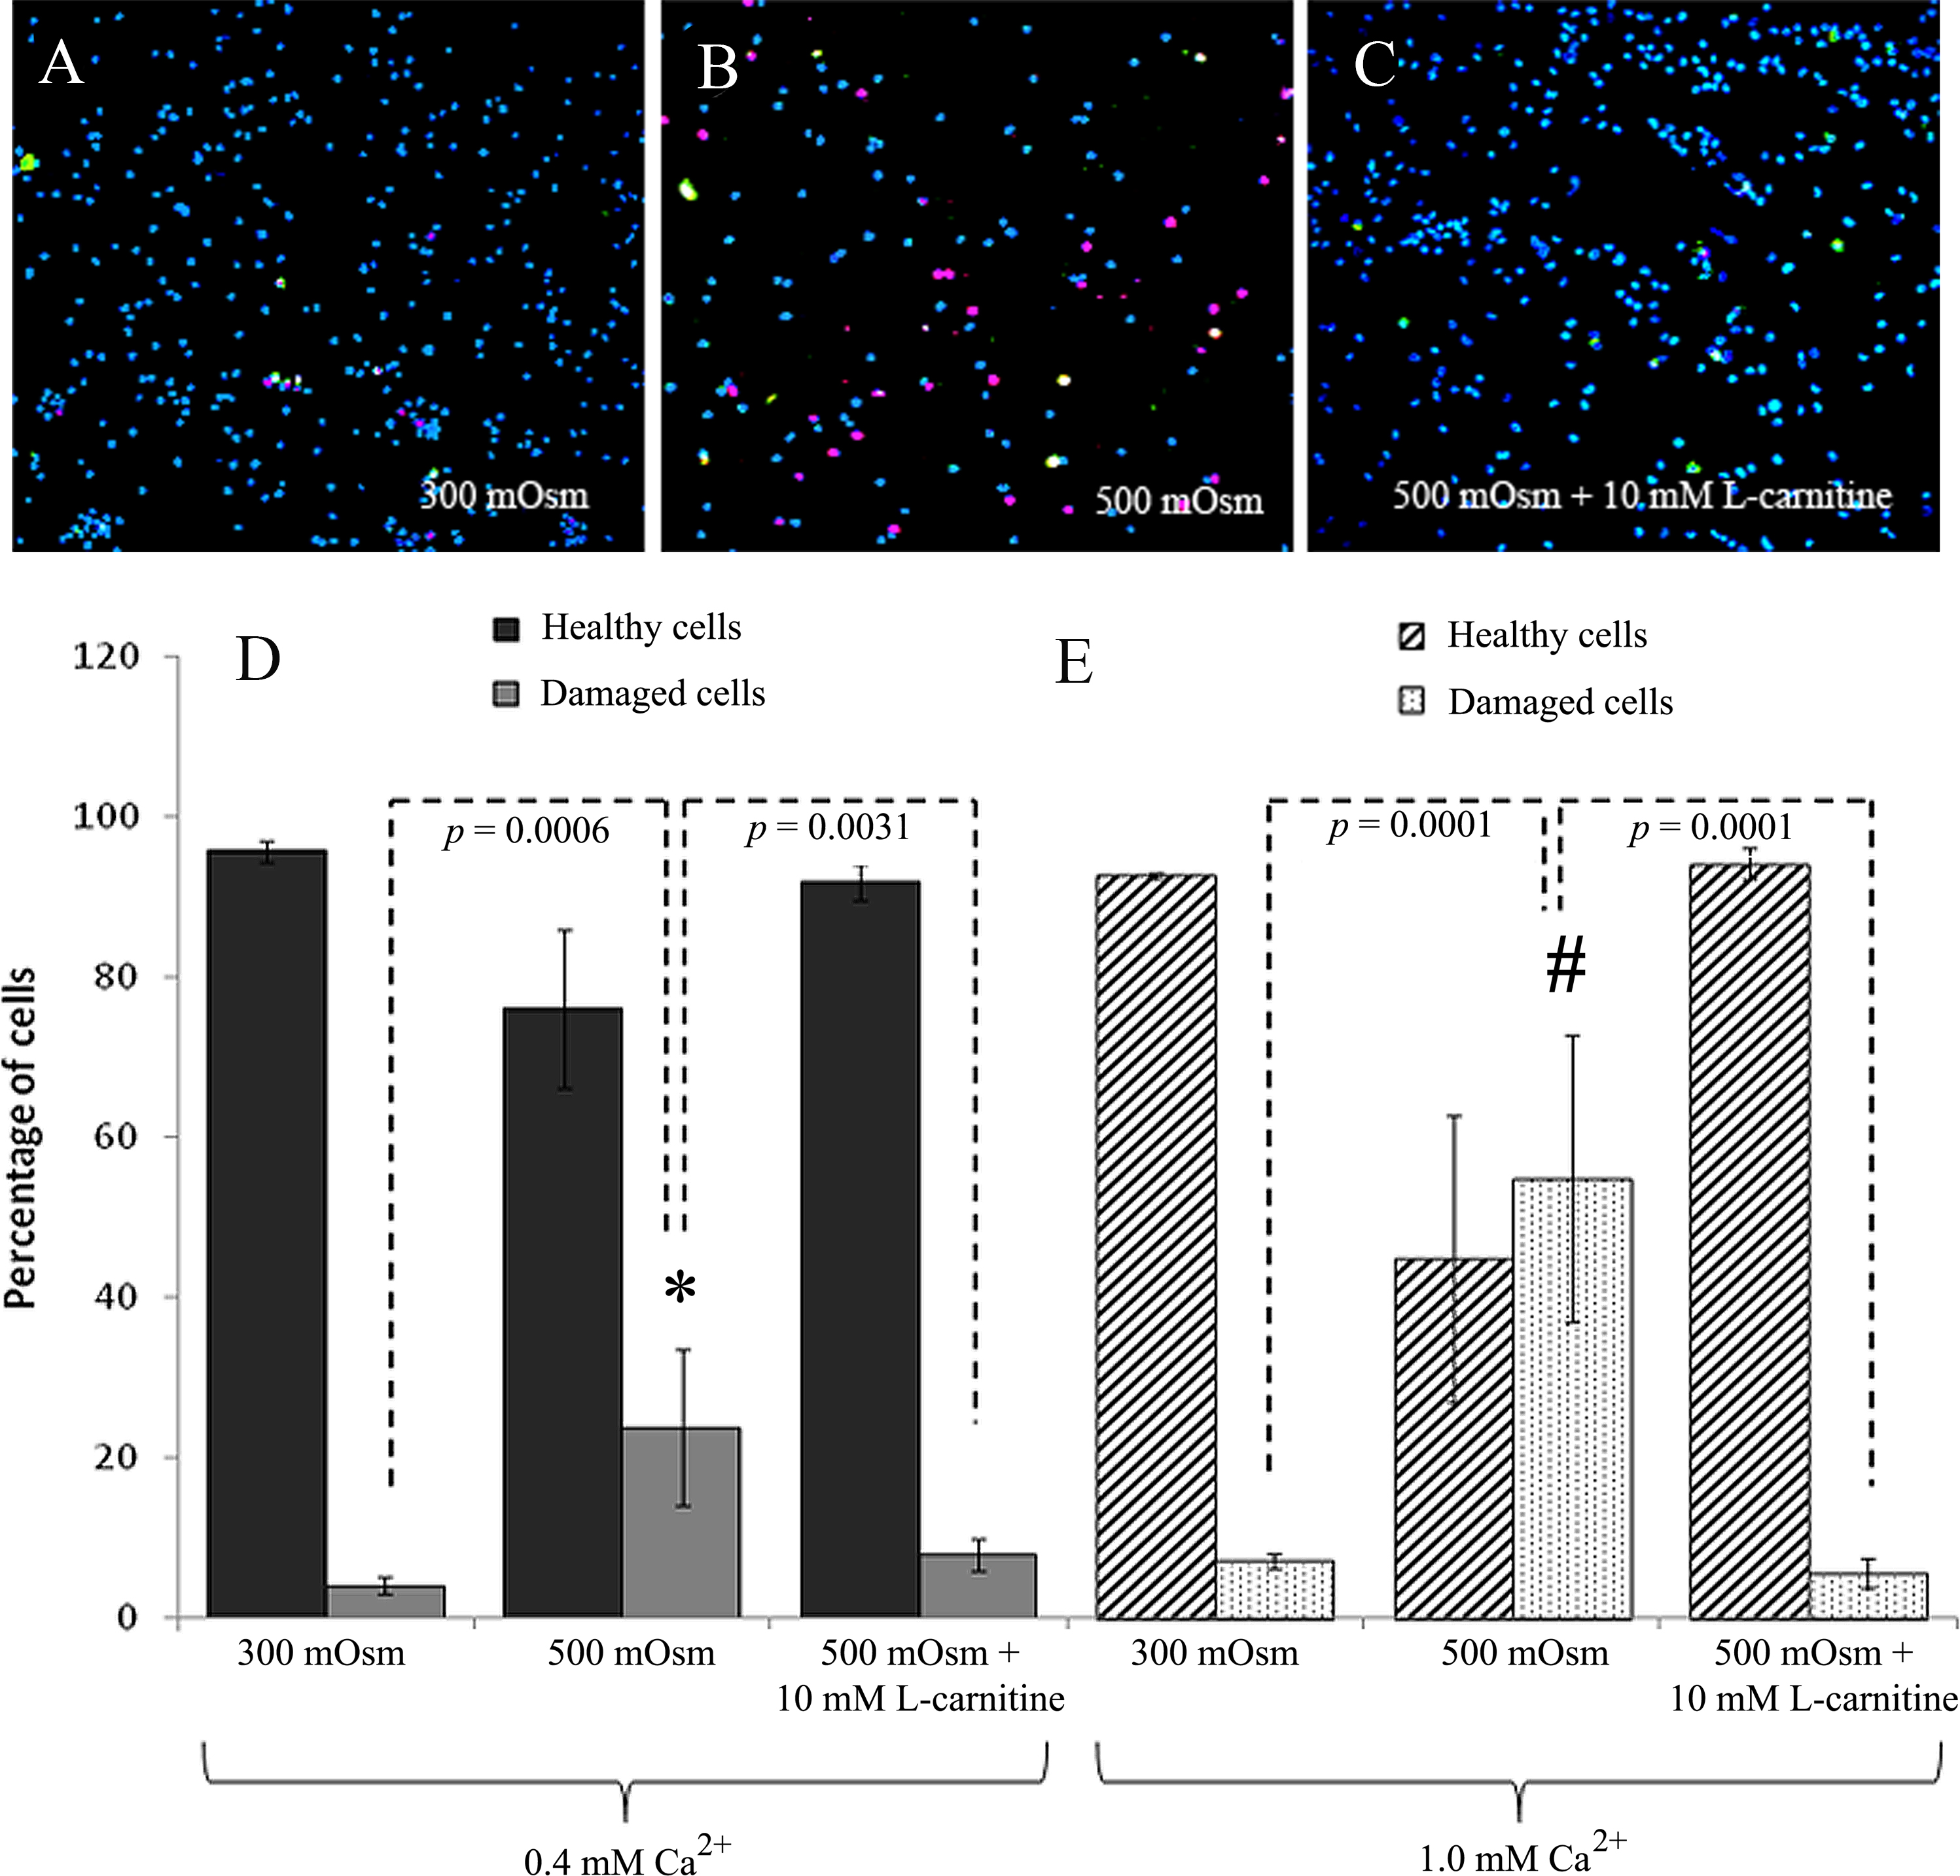
 Figure 3 of
Khandekar, Mol Vis 2013; 19:1945-1956.
Figure 3 of
Khandekar, Mol Vis 2013; 19:1945-1956.