Figure 2. Production of tumor necrosis factor-α by human corneal-limbal epithelial cells in response to isotonic (300 mOsm) or hyperosmotic
stress (500 mOsm) with or without carnitine (10 mM) for 16 h. Data represent the mean±SD of five samples. * shows the significant
difference between cells treated with and without L-carnitine during exposure to 500 mOsm medium osmolarity. # shows the significant difference from 300 mOsm medium.
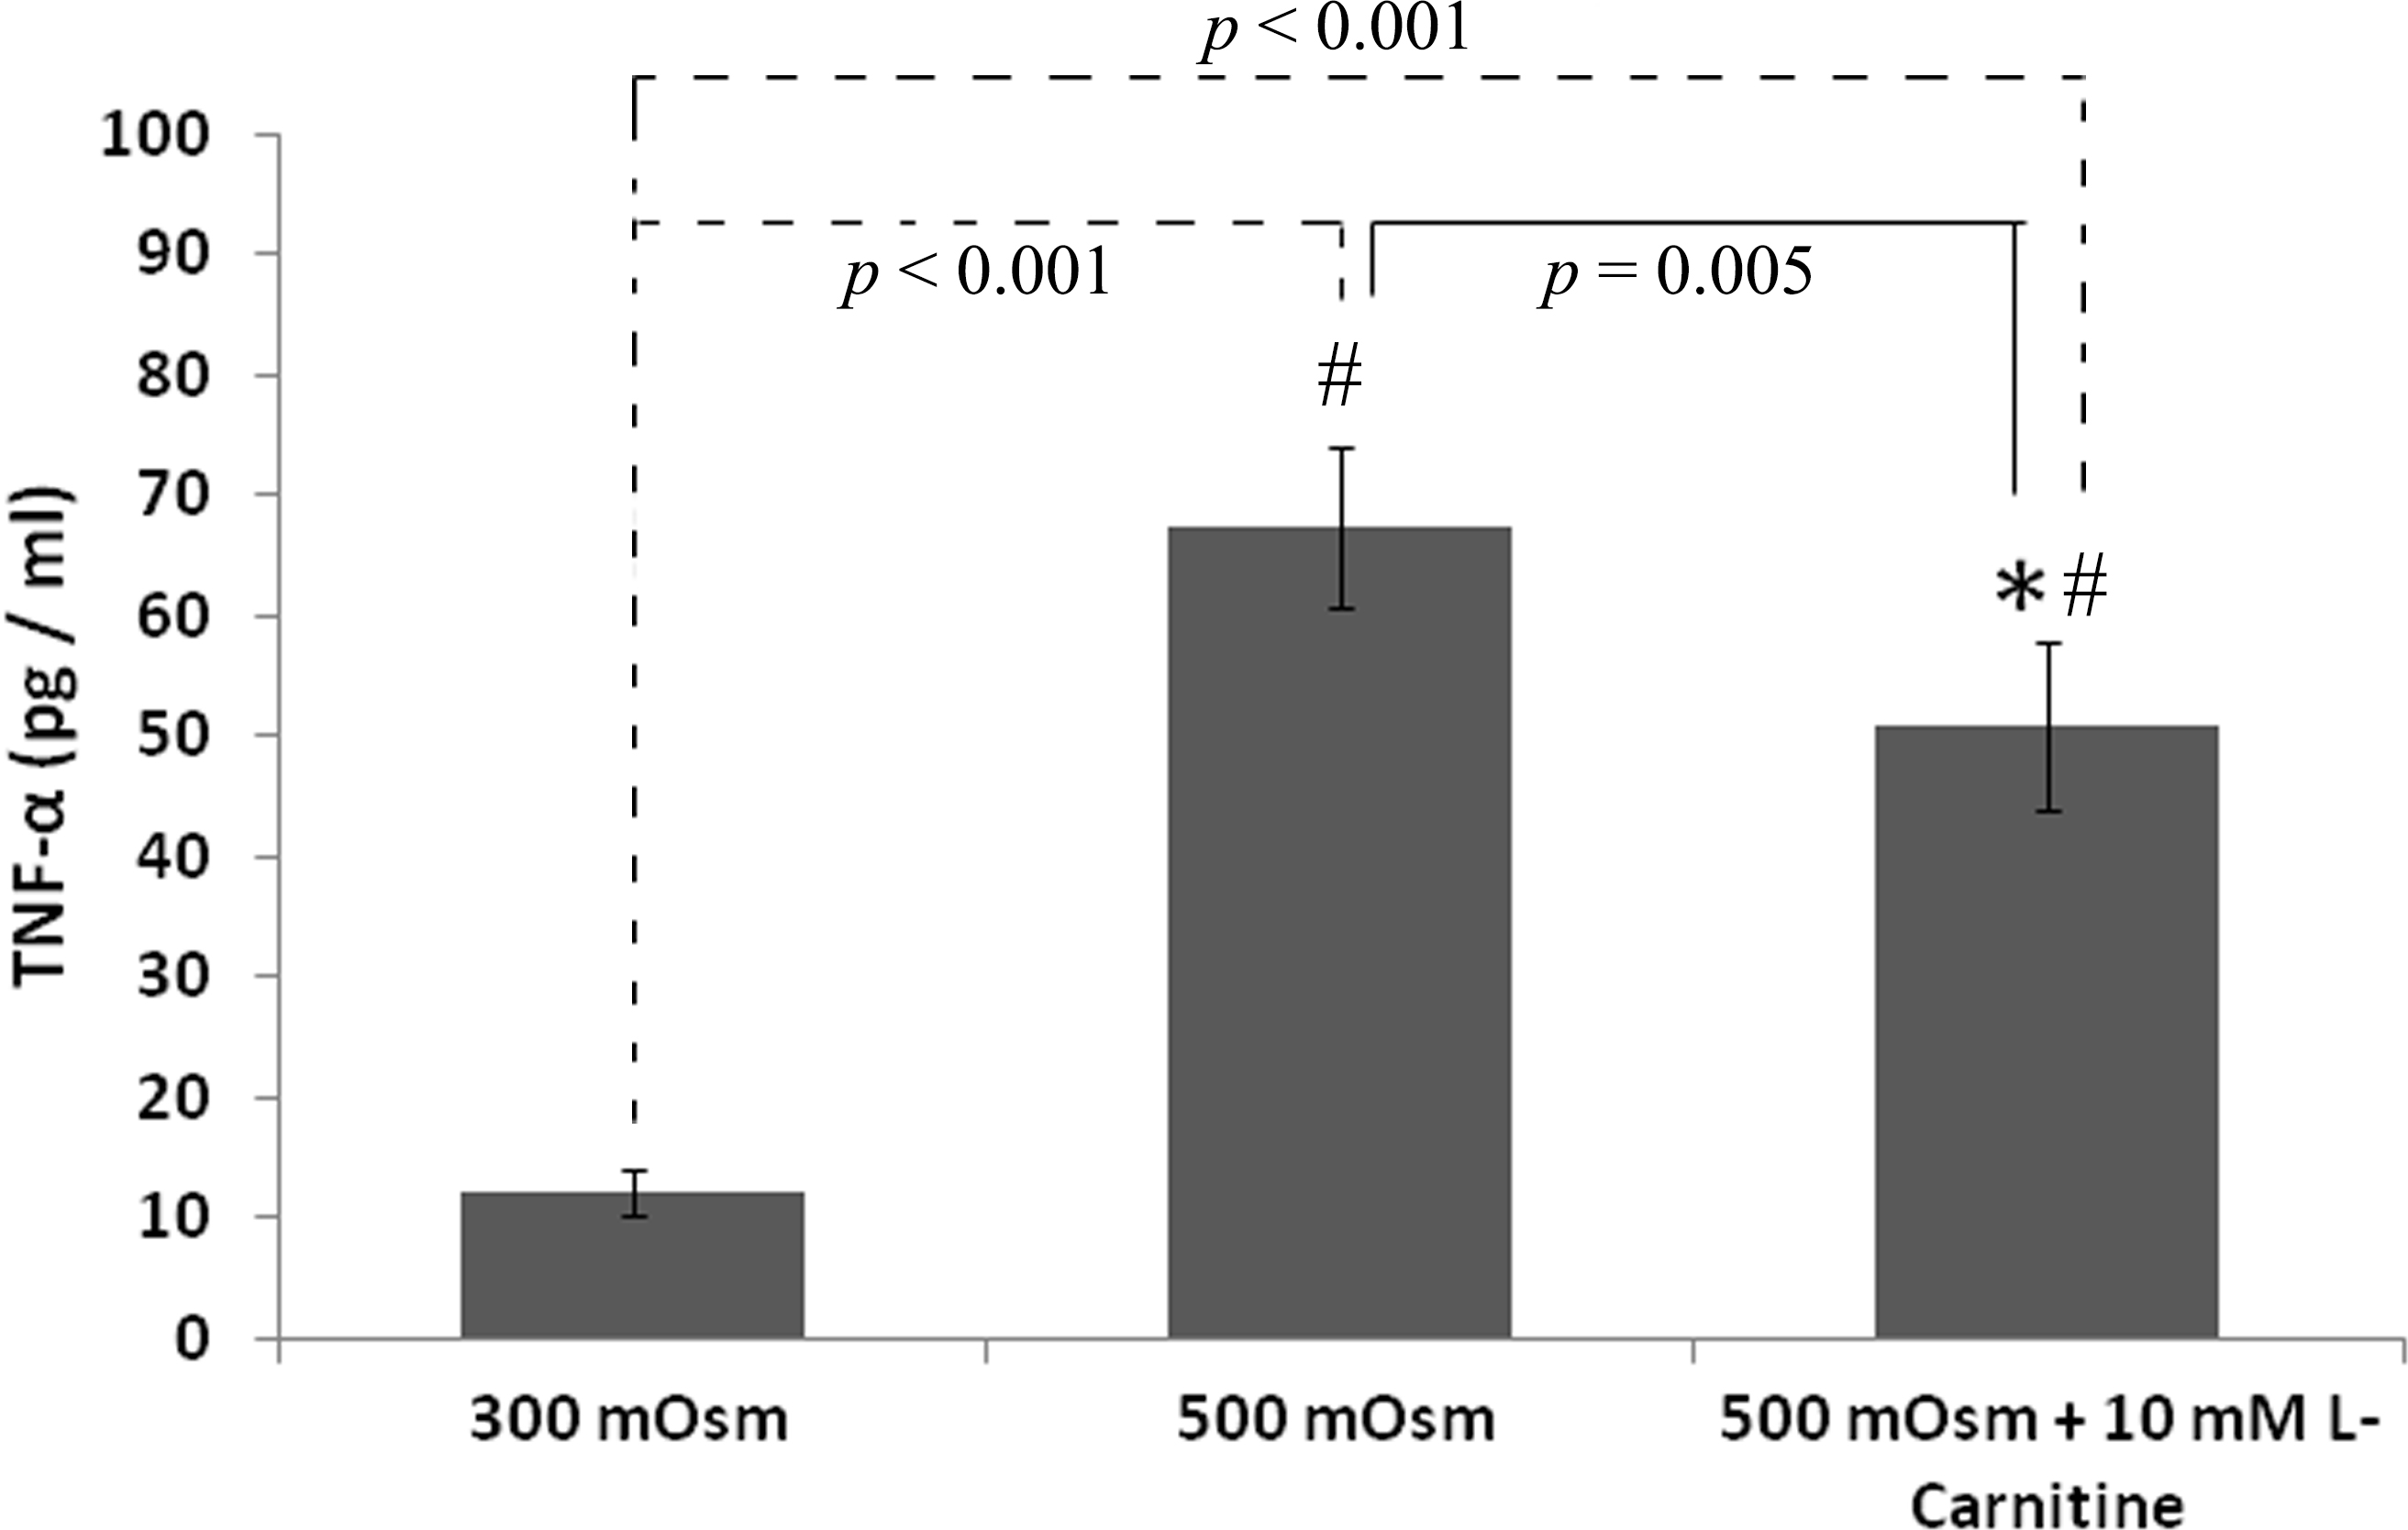
 Figure 2 of
Khandekar, Mol Vis 2013; 19:1945-1956.
Figure 2 of
Khandekar, Mol Vis 2013; 19:1945-1956.