Figure 1. Activity of caspase-9 (A), caspase-8 (B), and caspase-3/7 (C) during isotonic (300 mOsm) or hyperosmotic (500 mOsm) stress in the presence or absence of L-carnitine (10 mM). Data are
shown as the percentage mean±SD (n=6) over the isotonic medium group (300 mOsm). * shows the significant difference between
cells treated with and without L-carnitine during exposure to 500 mOsm medium osmolarity. # shows the significant difference from 300 mOsm medium.
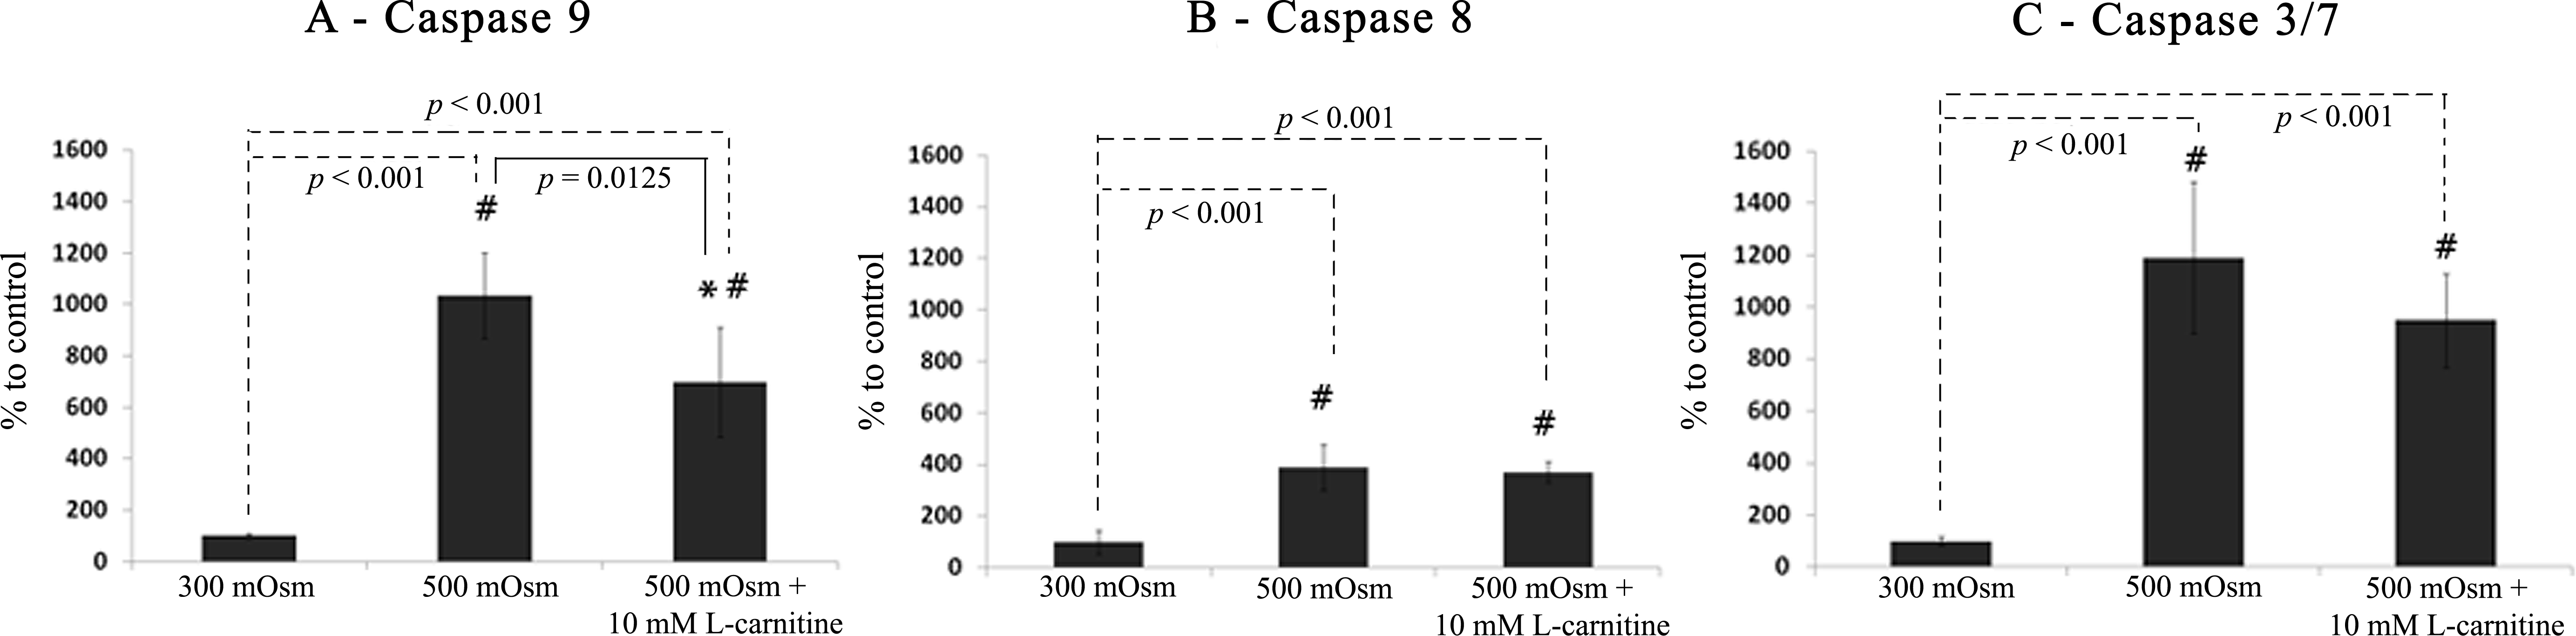
 Figure 1 of
Khandekar, Mol Vis 2013; 19:1945-1956.
Figure 1 of
Khandekar, Mol Vis 2013; 19:1945-1956.