Figure 3. Cytosolic calcium ([Ca2+]i ) response to N-methyl-D-aspartate (NMDA) receptor activation is consistent with the development of retinal ganglion cell
(RGC) phenotype by Notch-1 inhibition in human Müller glia with stem cell characteristics (hMGSCs). A: Examplary heat map images are shown with Fura Red-loaded hMGSCs cultured under control conditions and after treatment with
basement membrane protein (BMP), basic fibroblast growth factor-2 (FGF2) and N-[N-(3,5-Difluorophenacetyl)-L-alanyl]-S-phenylglycin
t-butyl ester (DAPT). The images are recorded at 40× magnification and are representative of fluorescence intensity before
(2 s) and at the maximum effect of receptor activation (6 s and 6.5 s, respectively). The color bar describes the intensity–color
relationship, with yellow being the brightest and black being the dimmest. Control cells showing a rapid decrease in fluorescence
intensity in response to NMDA exposure, which signifies an increase in [Ca2+]i, are marked with white arrows. Cells cultured with BMP, FGF2, and DAPT did not respond to NMDA with a reduction in fluorescence
intensity (left panel). In response to NMDA (2 mM), untreated hMGSCs (control, n=41 cells from two experiments) showed a strong
reduction in the inverted fluorescence intensity, displayed as a percentage of the value at 0 s, corresponding to an increase
in [Ca2+]i,. This was absent in hMGSCs treated with either BMP or FGF2 alone (n=32 cells from two experiments) or a combination of BMP,
FGF2, and DAPT (n=50 cells from 3 experiments), *** p<0.001 control versus BMP/FGF2 or BMP/FGF2/DAPT (right panel). B: The fraction of cells responding to NMDA with a rise in [Ca2+]i was greatly diminished after Notch-1 inhibition following differentiation without or with DAPT, in comparison to control
cells (n=50 from four experiments, respectively, *p<0.05).
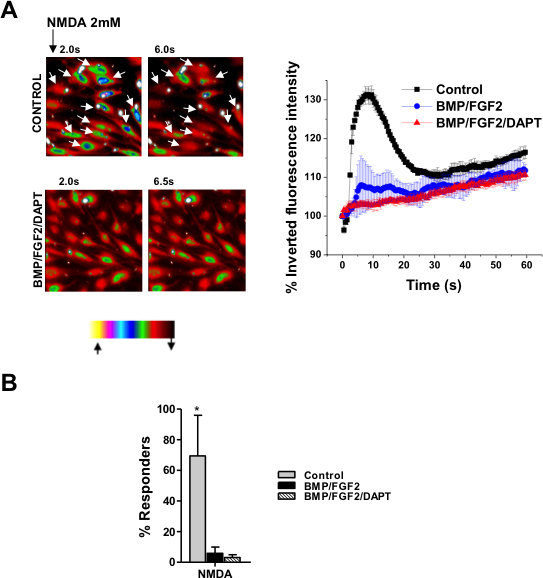
 Figure 3 of
Becker, Mol Vis 2013; 19:1925-1936.
Figure 3 of
Becker, Mol Vis 2013; 19:1925-1936.