Figure 4. IGF-1 activated the Erk1/2 and Akt pathways in primary cultured retinal ganglion cells. Cells exposed to normoxia or hypoxia
with or without IGF-1, 200 ng/ml, for 24 h. Western blot analysis was performed to detect (A) the activation of total Akt, phospho-Akt, and phosphorylation of Bad at serine 136 and (B) the activation of total Erk-1/2, phospho-Erk-1/2, and phosphorylation of Bad at serine 112. β-actin immunoreactivity from
the same gel is shown as the internal control. Histograms show the results of the relative protein level normalized to β-actin.
The results are expressed as the means±SEM from three independent experiments. * p<0.05 versus the normoxia group; #p<0.05 versus the hypoxia group.
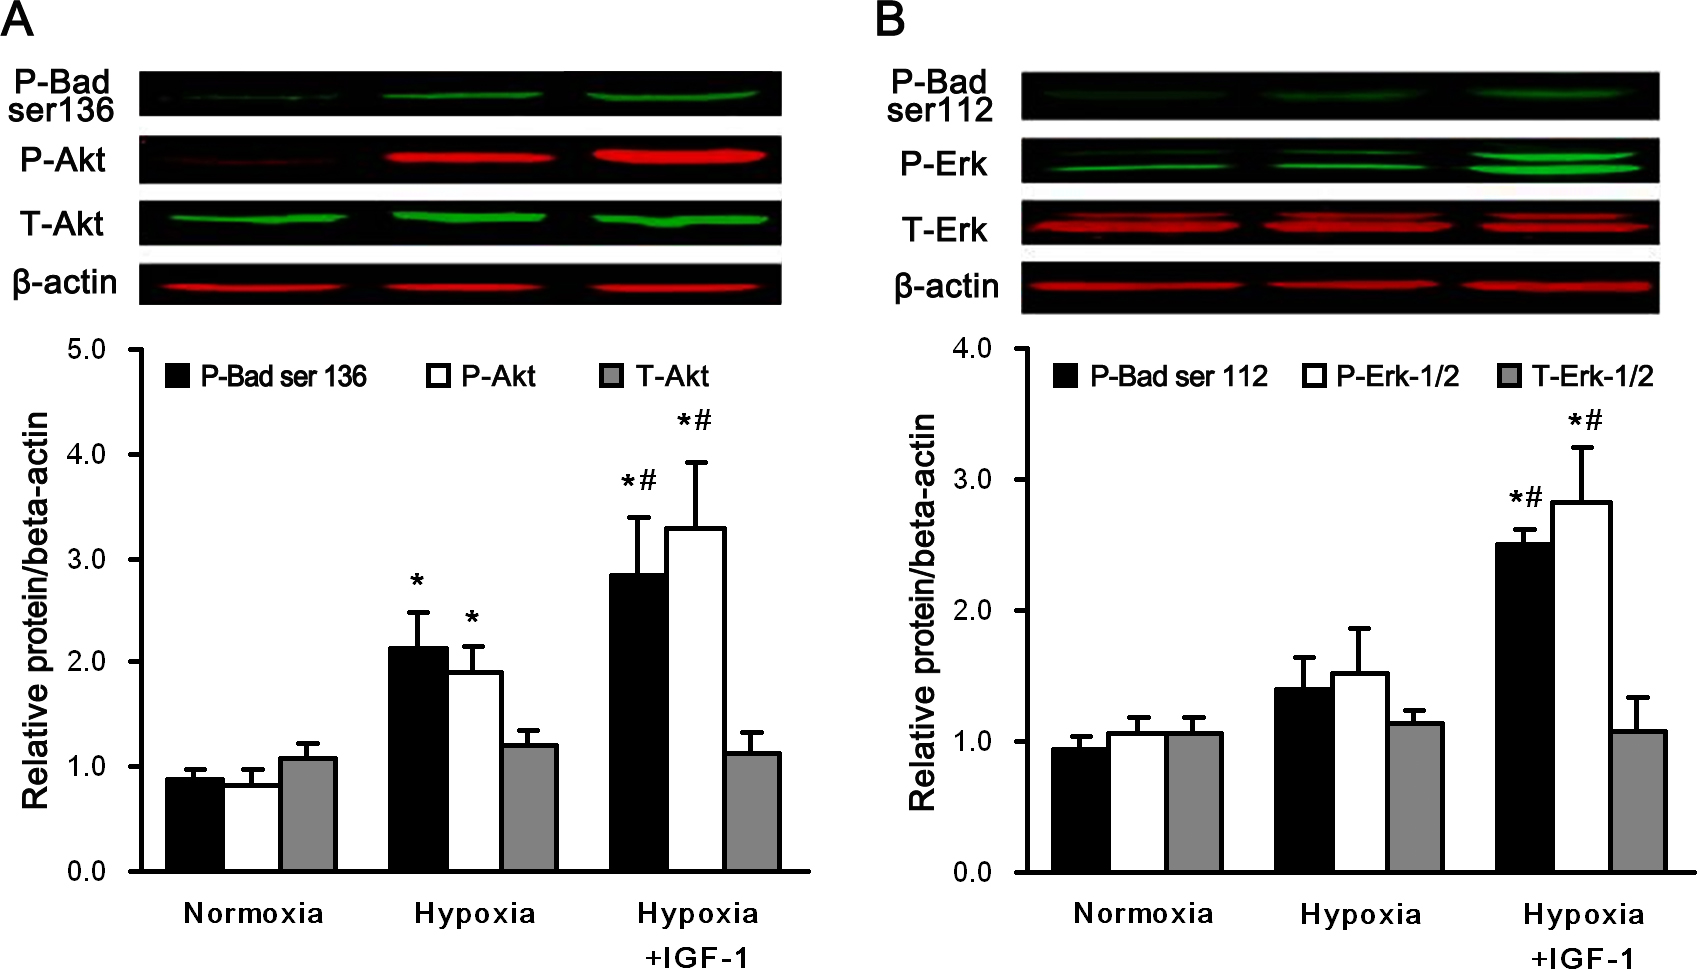
 Figure 4 of
Yang, Mol Vis 2013; 19:1901-1912.
Figure 4 of
Yang, Mol Vis 2013; 19:1901-1912.