Figure 3. Effects of IGF-1 on the mitochondrial membrane potential and the activity of caspase-3 in primary cultured retinal ganglion
cells exposed to hypoxia. Cells were exposed to normoxia or hypoxia for 24 h in the absence or presence of insulin-like growth
factor-1 (IGF-1; 200 ng/ml). A: JC-1 measured the mitochondrial membrane potential (ΔΨm). B: Caspase-3 protease activity in the cells was measured using a caspase-3 colorimetric assay kit. C: Western blot analysis for the active subunit of caspase-3 (17 kDa) and β-actin (42 kDa). β-actin immunoreactivity from the
same gel is shown as the internal control. The histogram shows the relative protein level normalized to β-actin. Representative
results of three independent experiments are shown. The results are expressed as the means ±SEM. * p<0.05, ** p<0.01 versus
the normoxia group; # p<0.05, ## p<0.01 versus the hypoxia group.
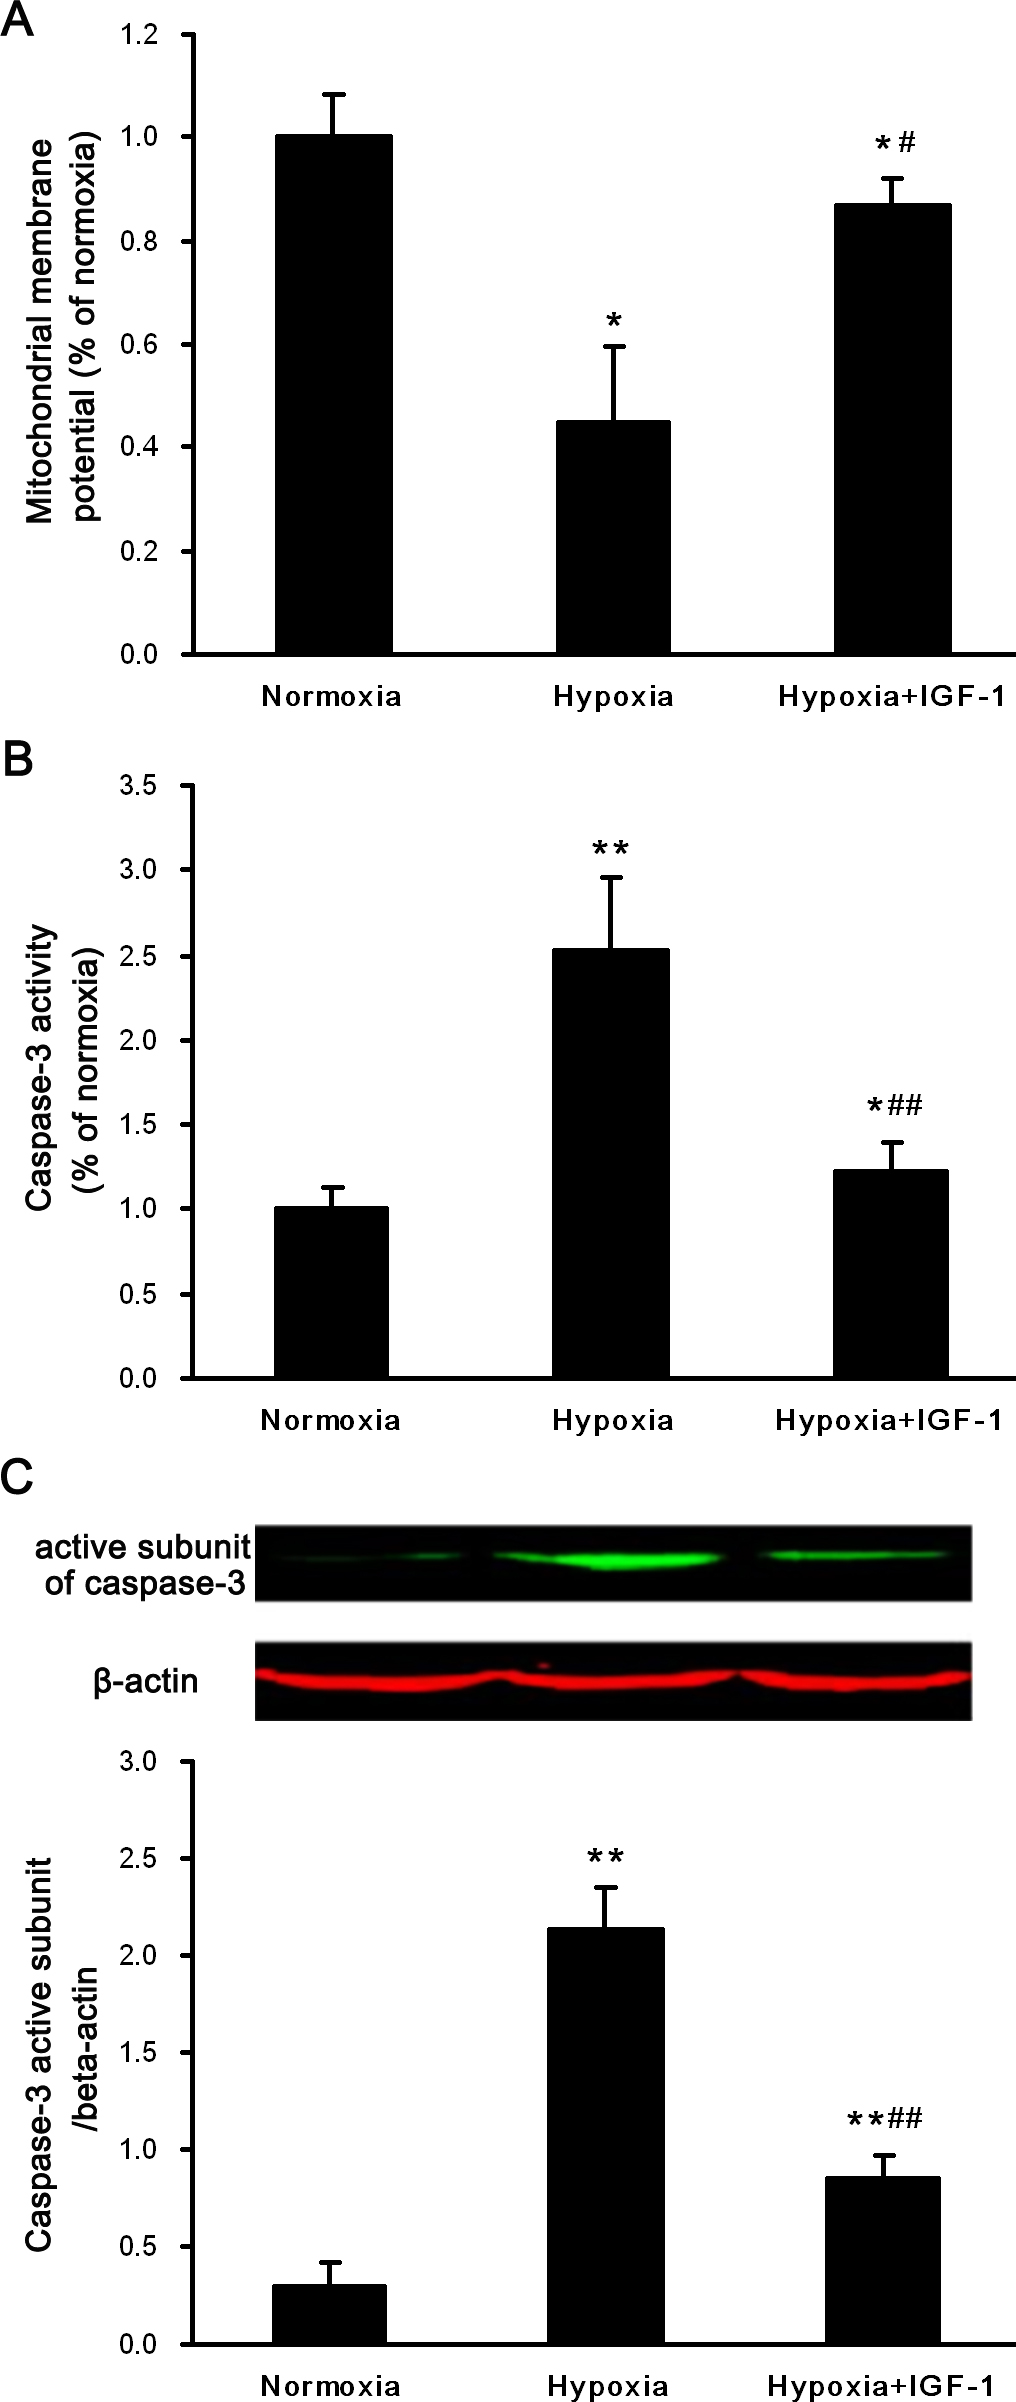
 Figure 3 of
Yang, Mol Vis 2013; 19:1901-1912.
Figure 3 of
Yang, Mol Vis 2013; 19:1901-1912.