Figure 2. IGF-1 protects primary cultured retinal ganglion cells from hypoxia-induced apoptosis. A–C: Nuclear morphology is indicated by Hoechst 33342 staining, and (D–F) DNA breaks were detected by TUNEL analyses. A, D: Primary cultured retinal ganglion cells (RGCs) were grown with normoxia for control, (B, E) cells were subjected to hypoxia for 24 h, and (C, F) cells were incubated with 200 ng/ml IGF-1 and subjected to hypoxia. The scale bar represents 50 μm. G: Percentage of apoptotic cells at different time points. Primary cultured RGCs were grown with normoxia or hypoxia. The hypoxia
duration 0 h group is the normoxia group. Serial concentrations of IGF-1 (50, 100, and 200 ng/ml) were administered to cultured
RGCs before hypoxia was induced to verify the protective effect of IGF-1. TUNEL-positive nuclei were counted in the five non-overlapping
fields per coverslip, and then converted to percentages by comparison to the total number of nuclei. The results are expressed
as the means ± SEM (standard error of the mean) from three independent experiments. * p<0.05, ** p<0.01 versus the normoxia
group; # p<0.05, ## p<0.01 versus the hypoxia group.
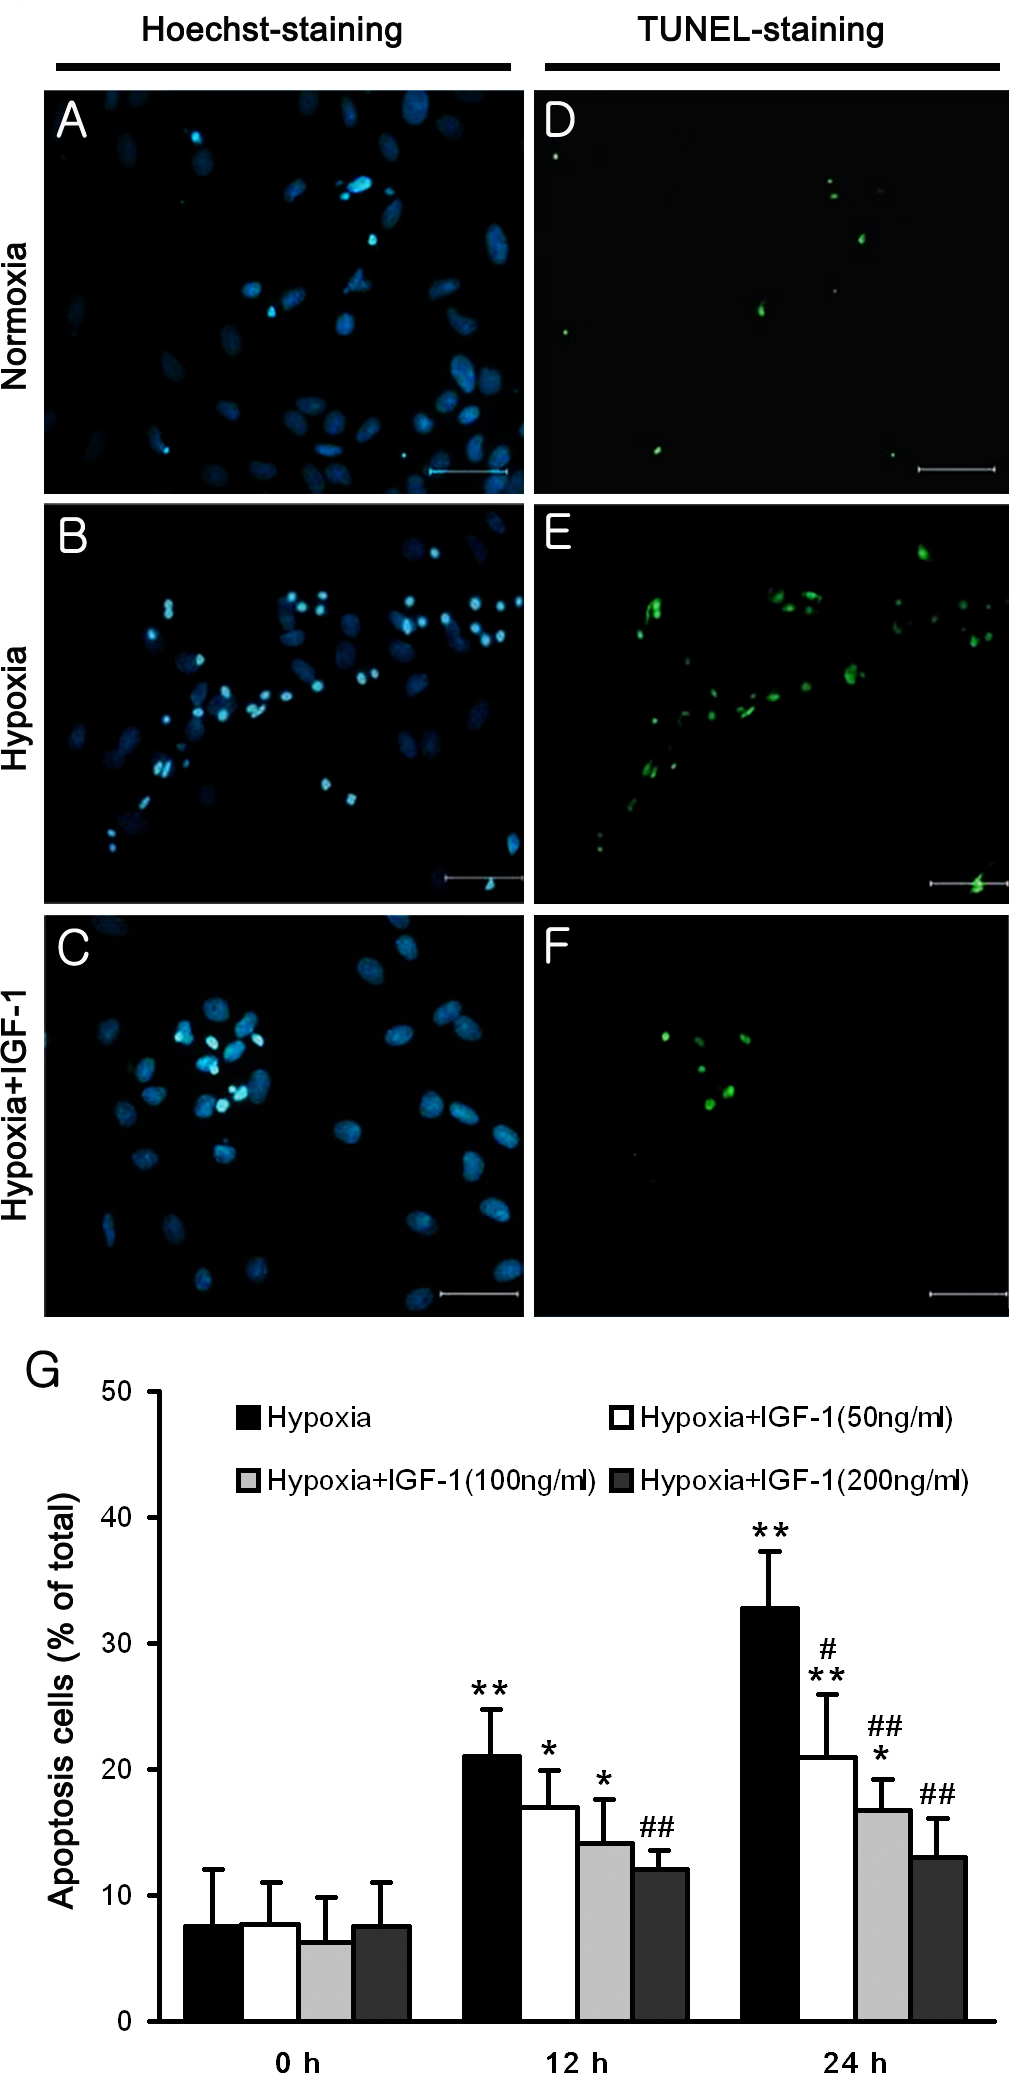
 Figure 2 of
Yang, Mol Vis 2013; 19:1901-1912.
Figure 2 of
Yang, Mol Vis 2013; 19:1901-1912.