Figure 3. Manhattan plot presenting genome-wide association study results in Basenji progressive retinal atrophy (PRA). y-axis=Probability
statistic (–log10(P)) for association test analyzed using PLINK. X-Axis=single nucleotide polymorphisms ordered on chromosomes (chromosomes
39 and 41 represent the X-chromosome, and chromosome 40 the Y chromosome). The highest –log10(P) values are observed on CFA4, CFA13, and CFA25 as denoted by the black arrows.
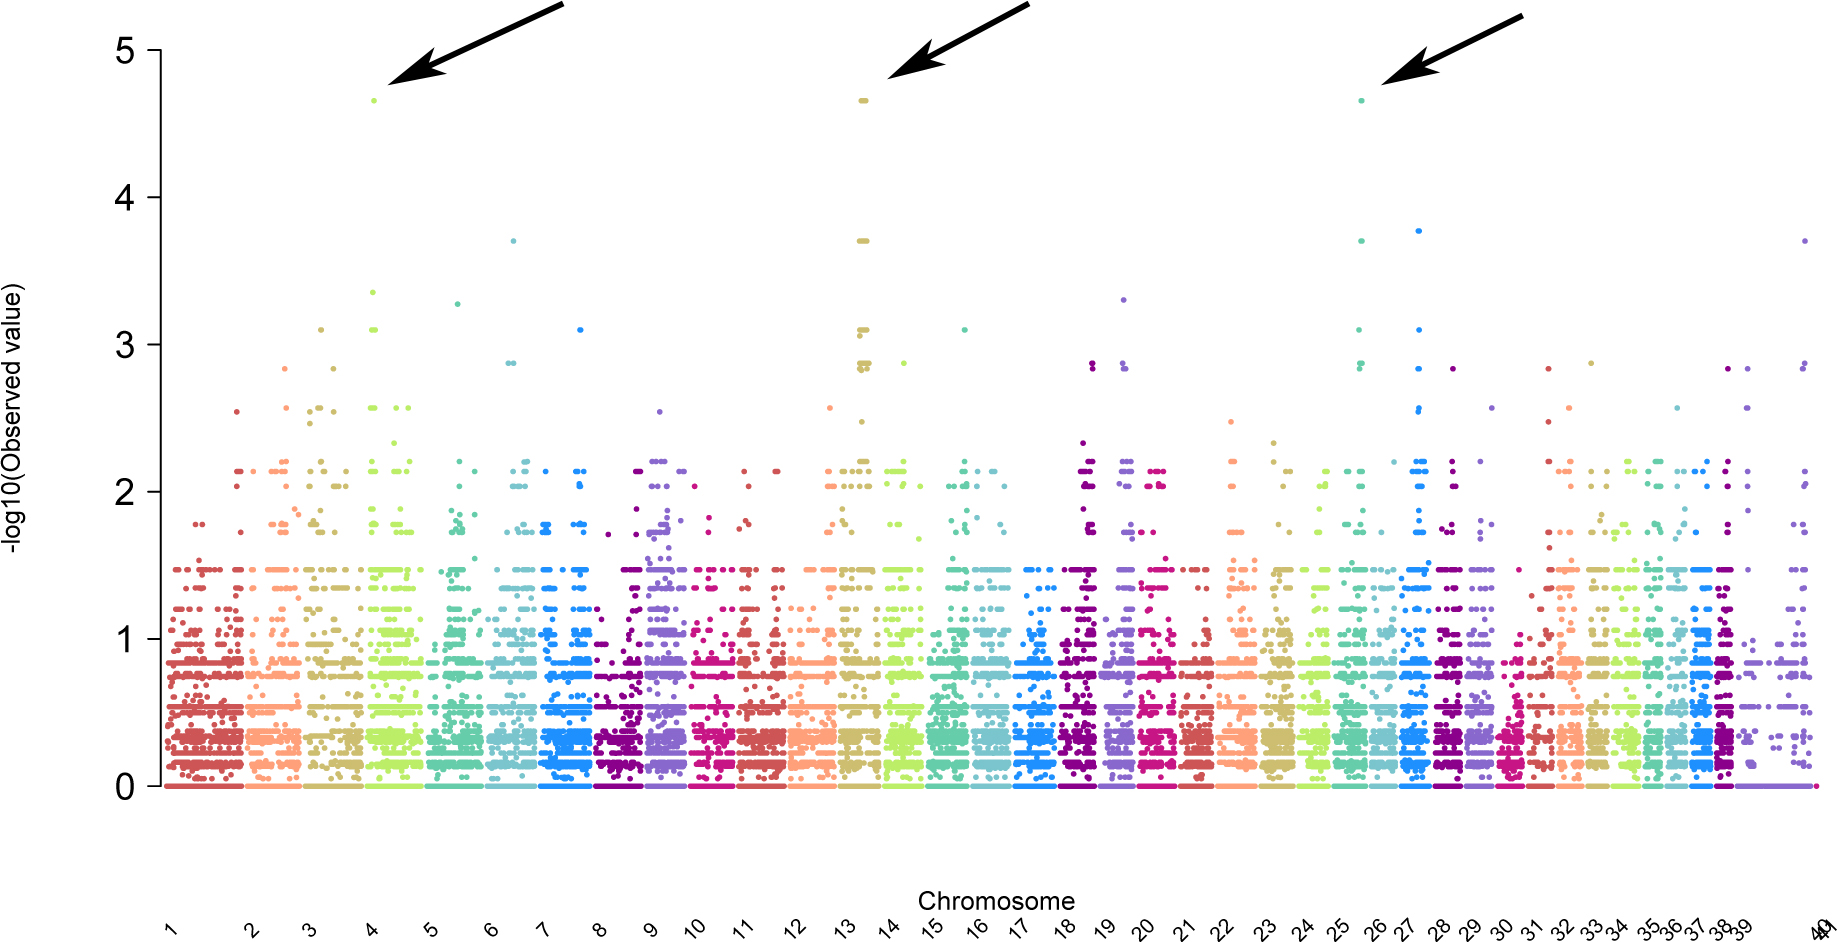
 Figure 3 of
Goldstein, Mol Vis 2013; 19:1871-1884.
Figure 3 of
Goldstein, Mol Vis 2013; 19:1871-1884.