Figure 7. Mouse axon guidance pathway map. Adapted from the mmu04360 KEGG pathway. EphA6, Sema3F, and PTPRO are localized in red in
the pathway. Note that PTPRO was originally absent from the map. Outputs of the ephrin and semaphorin pathways are underlined
with red dotted lines. Green boxes: genes or gene products; rounded white boxes: connected pathways; solid arrows: direct
interactions; dotted arrows: indirect interactions. Normal arrows symbolize activation, headless arrows symbolize inhibition.
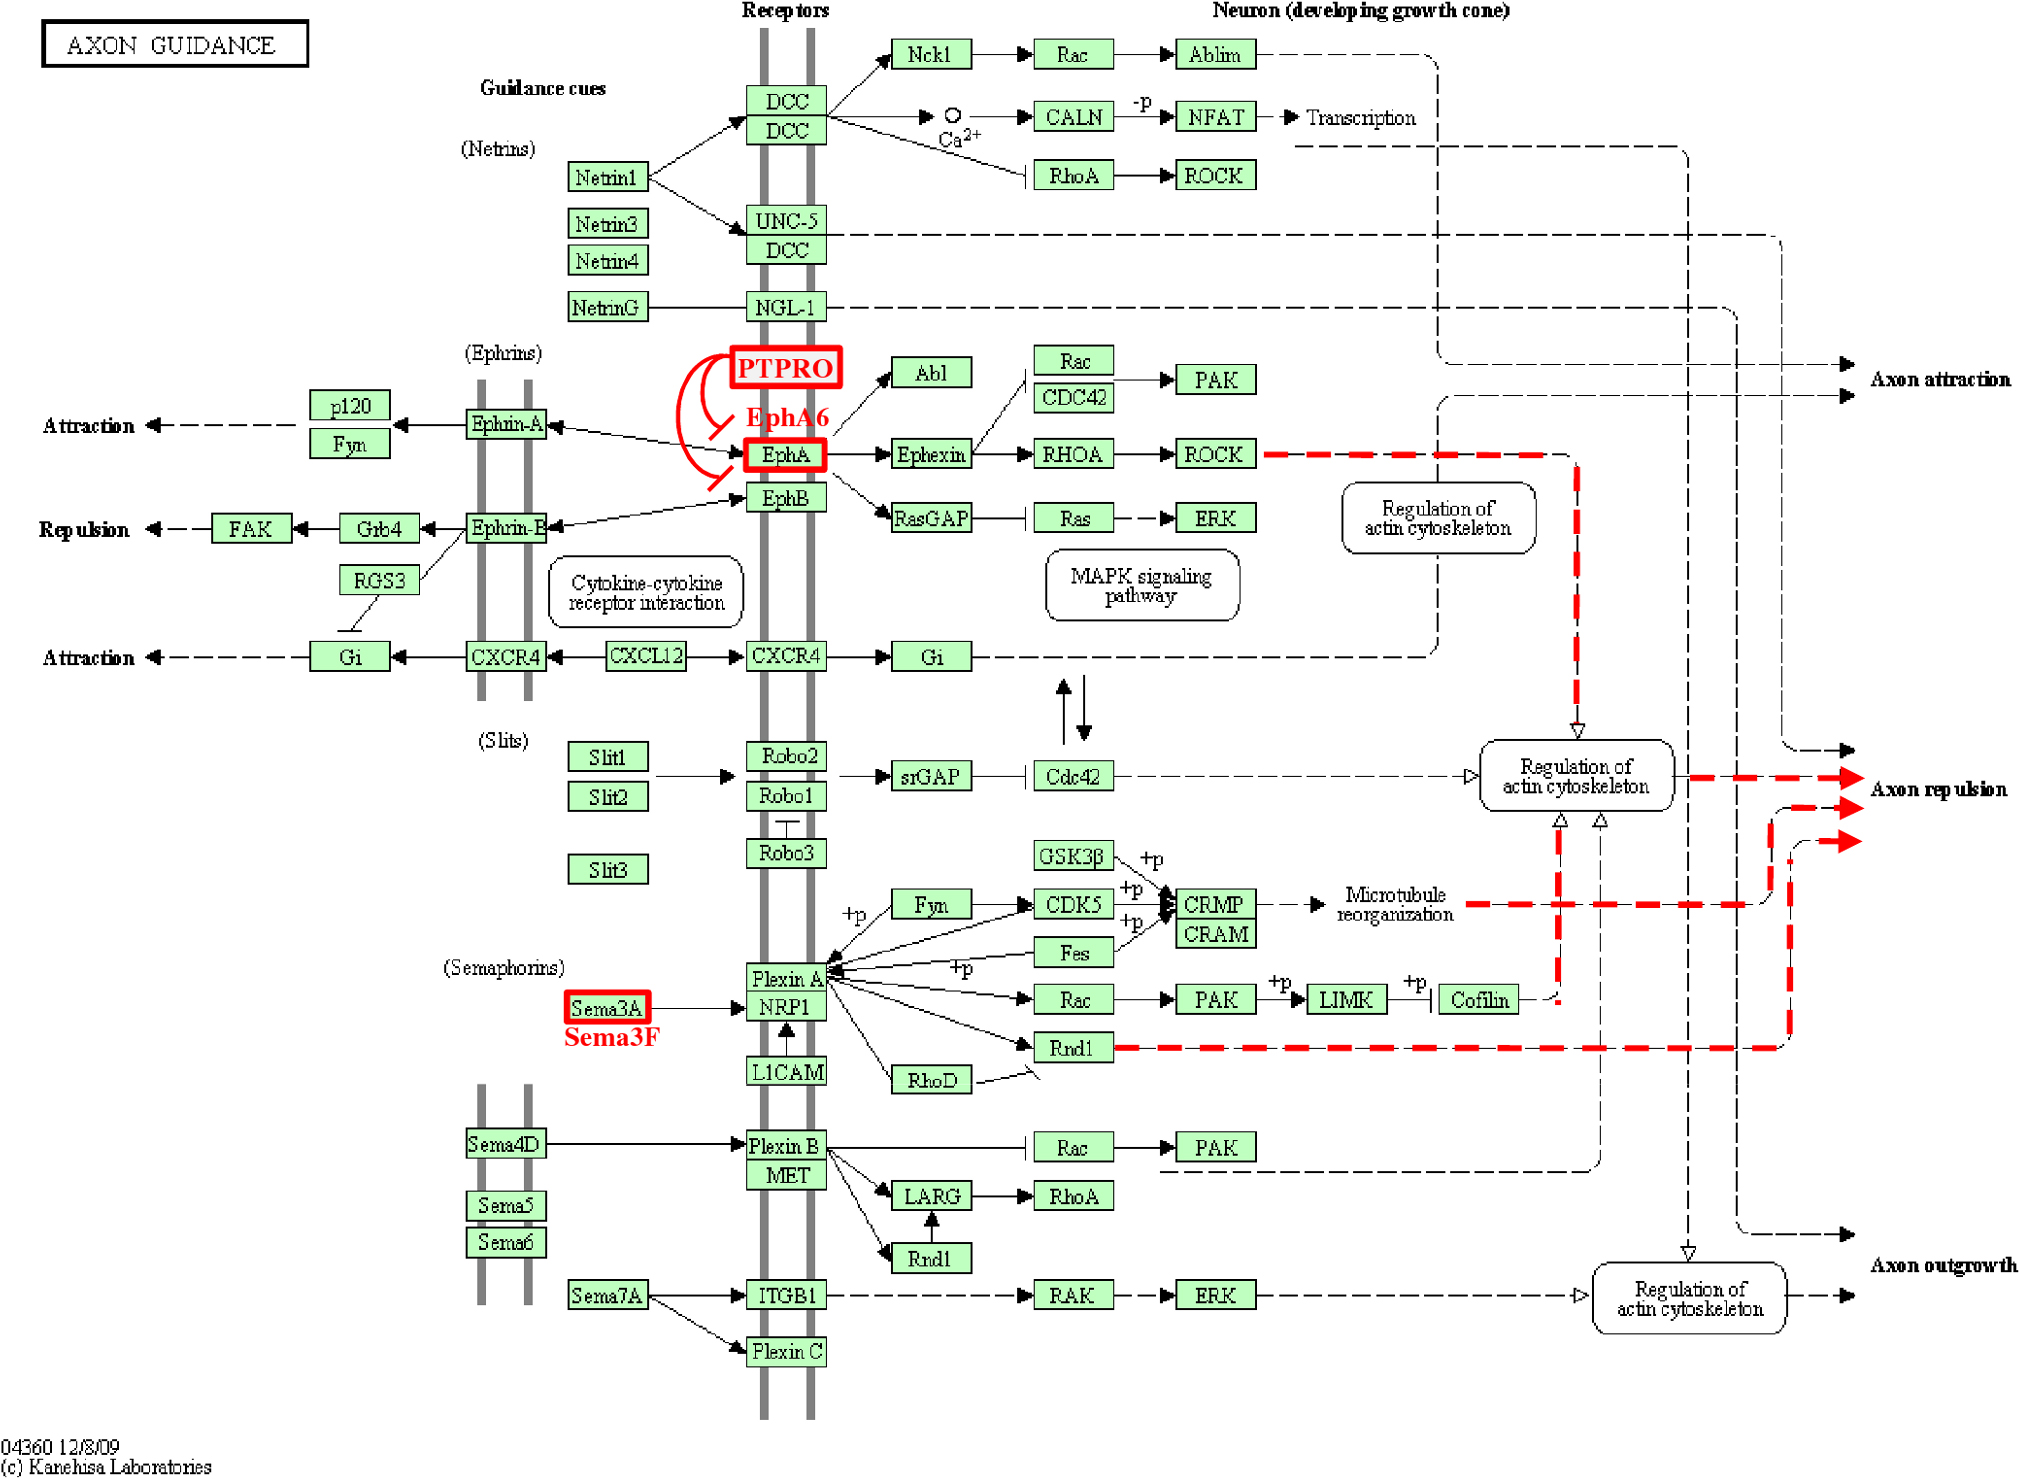
 Figure 7 of
Boulling, Mol Vis 2013; 19:1779-1794.
Figure 7 of
Boulling, Mol Vis 2013; 19:1779-1794.