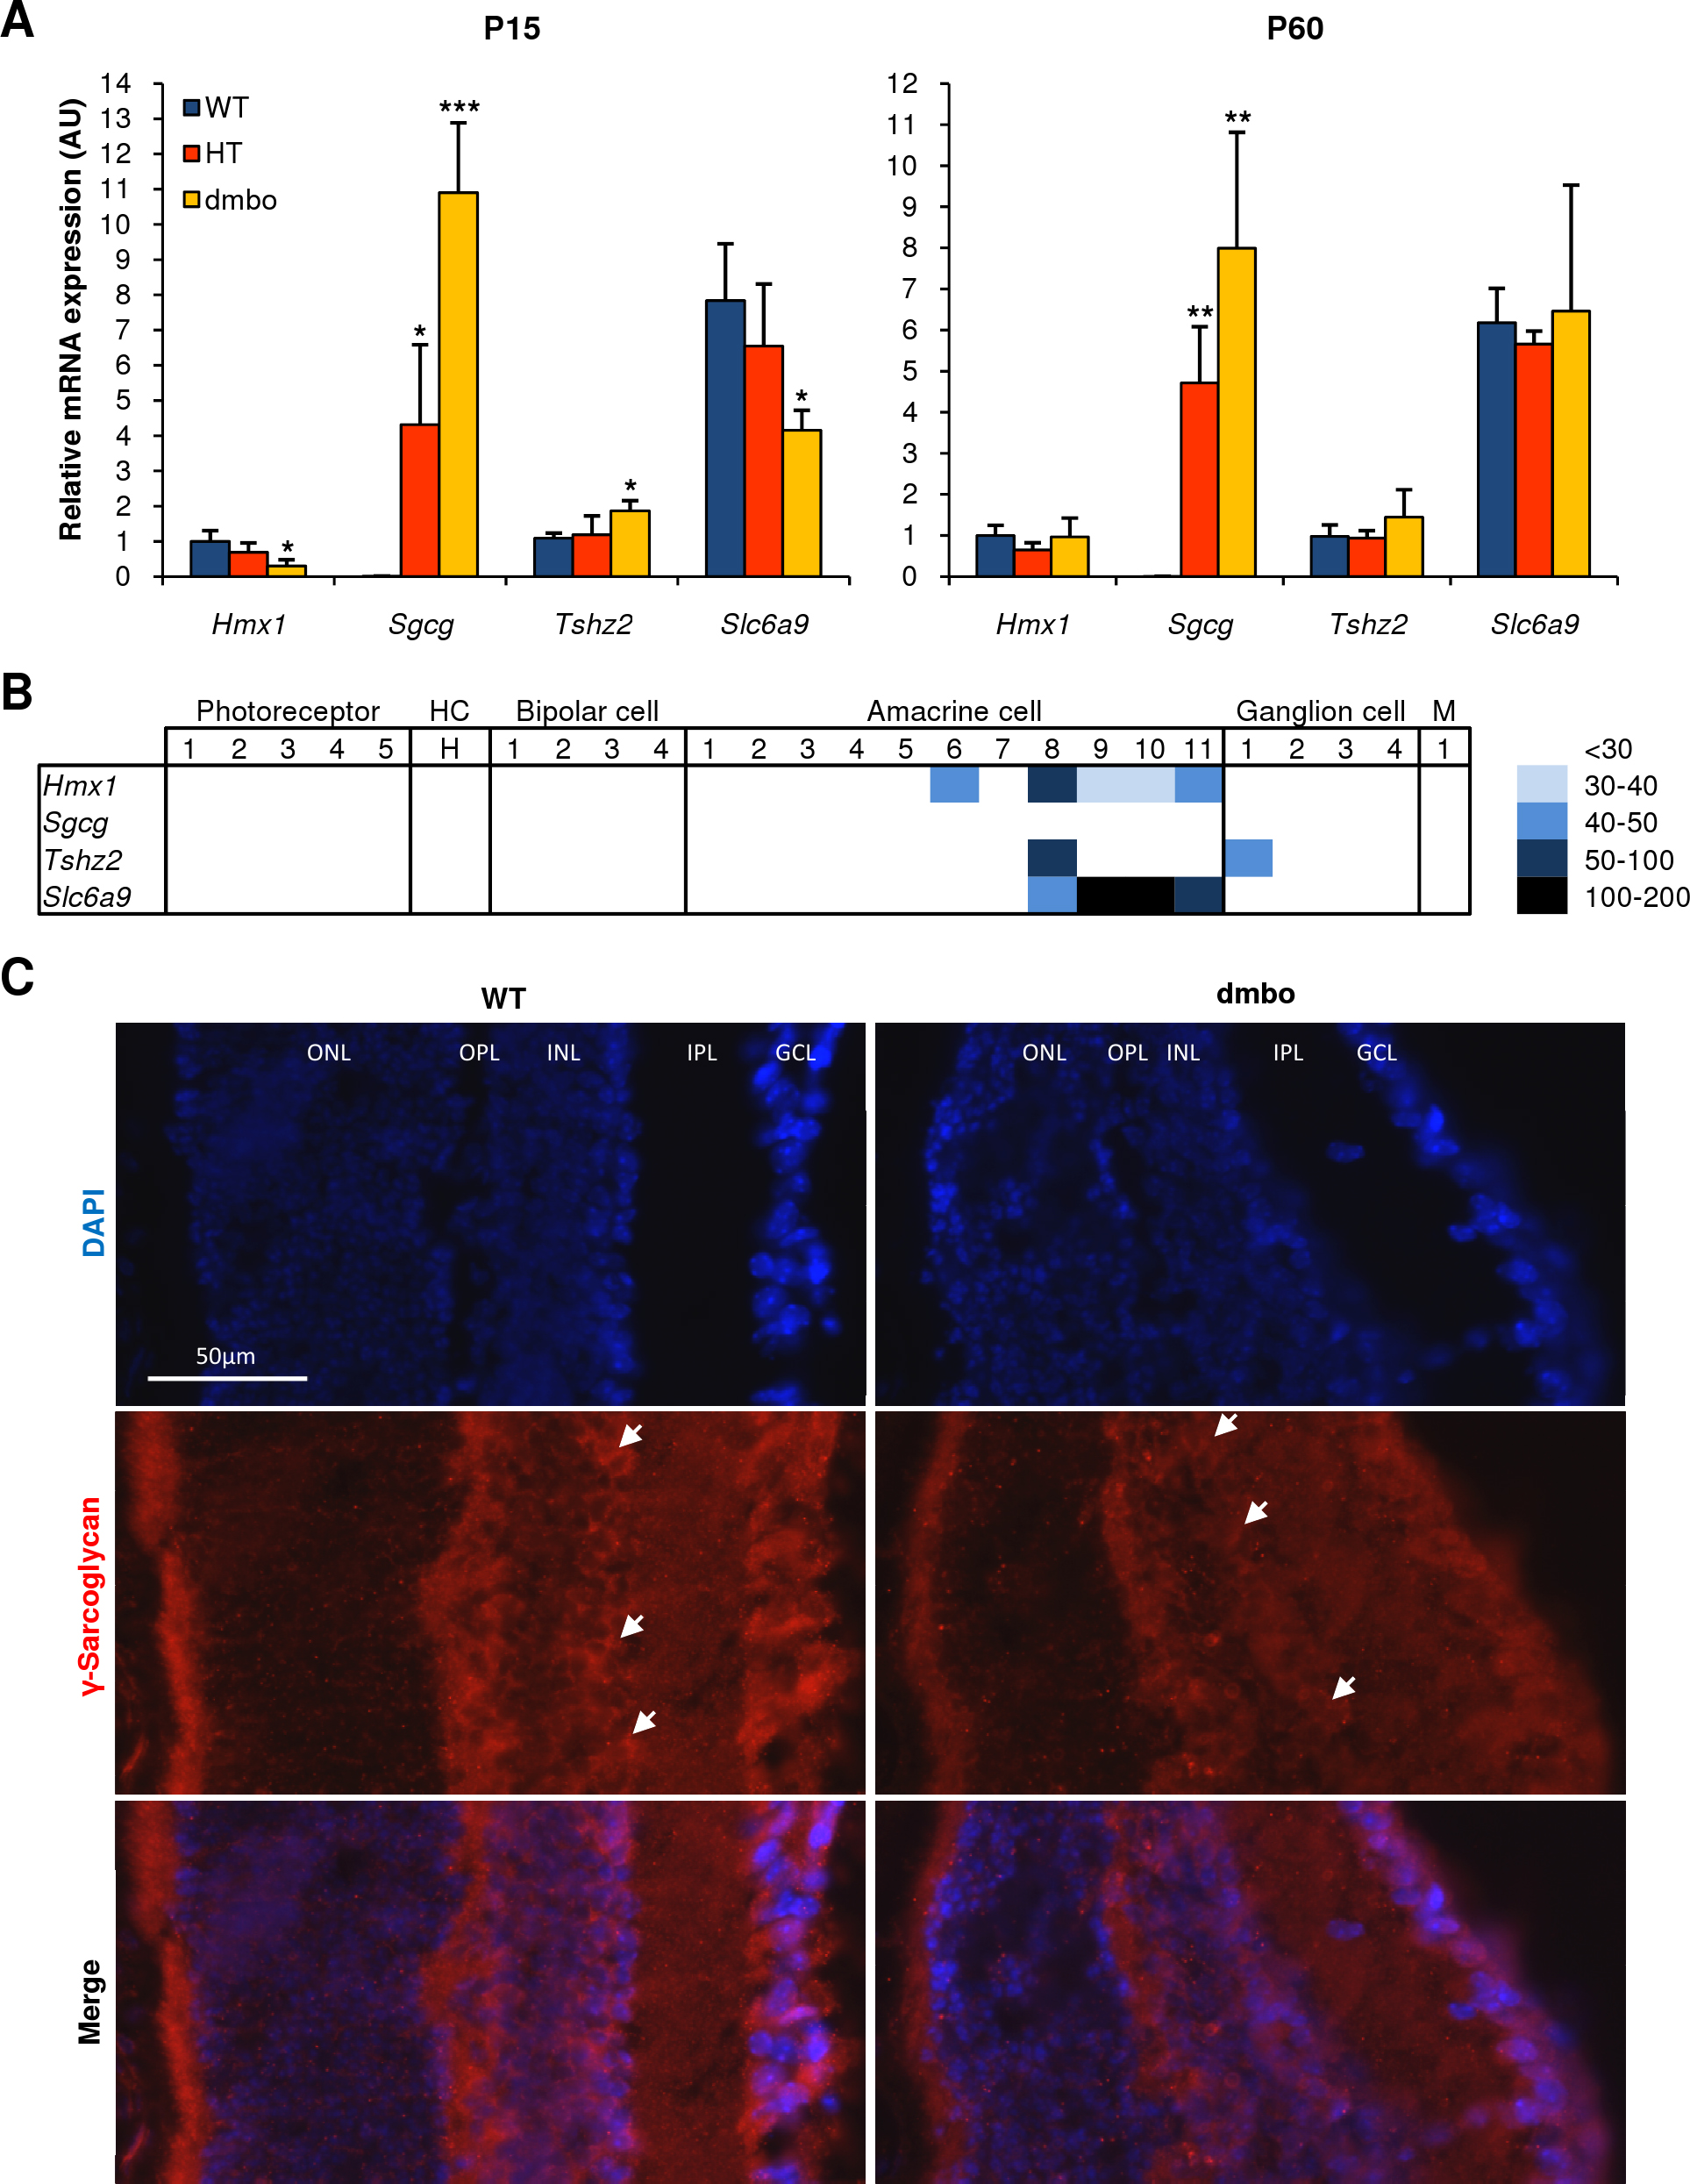
Figure 3. Characterization of
Sgcg,
Tshz2, and
Slc6a9 expression.
A: Quantitative reverse transcription polymerase chain reaction (qPCR) analysis of
Sgcg,
Tshz2, and
Slc6a9 expression in wild type (WT), heterozygous (HT), and
dmbo whole retina at P15 and P60. The significance of the differences between the WT and HT or
dmbo mean mRNA expression levels were determined by three independent experiments done in triplicate. All qPCR efficiencies were
above 1.96 with a Pearson’s r above 0.99. The mRNA levels are expressed as a ratio of the H6 homeobox family 1 (
Hmx1) WT level, in P15 and P60 experiments, independently. Bars, SD; *p<0.01, **p<0.05, ***p<0.001. AU, arbitrary units.
B: Heatmap representation of
Hmx1,
Sgcg,
Tshz2, and
Slc6a9 expression in the different cell types of the mouse retina according to the gene expression profile database [
22].
C: Immunostaining of γ-Sarcoglycan in the WT and
dmbo retina at P15. White arrows indicate an accumulation of γ-Sarcoglycan at the border delimitating the INL and the IPL. DAPI,
4',6-diamidino-2-phenylindole dihydrochloride staining; Merge, overlap between DAPI and γ-SG immunostaining. ONL, Outer nuclear
layer; OPL, Outer plexiformlayer; INL, Inner nuclear layer; IPL, Inner plexiform layer; GCL, Ganglion cell layer.
 Figure 3 of
Boulling, Mol Vis 2013; 19:1779-1794.
Figure 3 of
Boulling, Mol Vis 2013; 19:1779-1794.