Figure 2. Elaboration and statistical validation of an Hmx1 predictive promoter model. A: Flowchart of the predictive promoter model (PPM) construction. #Location of CAAGTG motifs within proximal promoter or 5'UTR
region is given in (B). B: Details of Sgcg, Tshz2, and Slc6a9 promoter structure. Forward (CAAGTG) and reverse (CACTTG) HMX1 binding sites (HMX1-BSs) are symbolized by black and white triangles, respectively. The H letter indicates an HMX1-BS that
is strictly conserved in human. C: Statistical validation of the PPM. Columns represent the percentage of promoters carrying at least 1 HMX1-BS or fitting
the PPM in each group. Promoter count details are indicated for the false discovery rate (FDR)<0.1 group and the (+)-training
set (FDR<0.01 group). *p<0.01, **p<0.001.
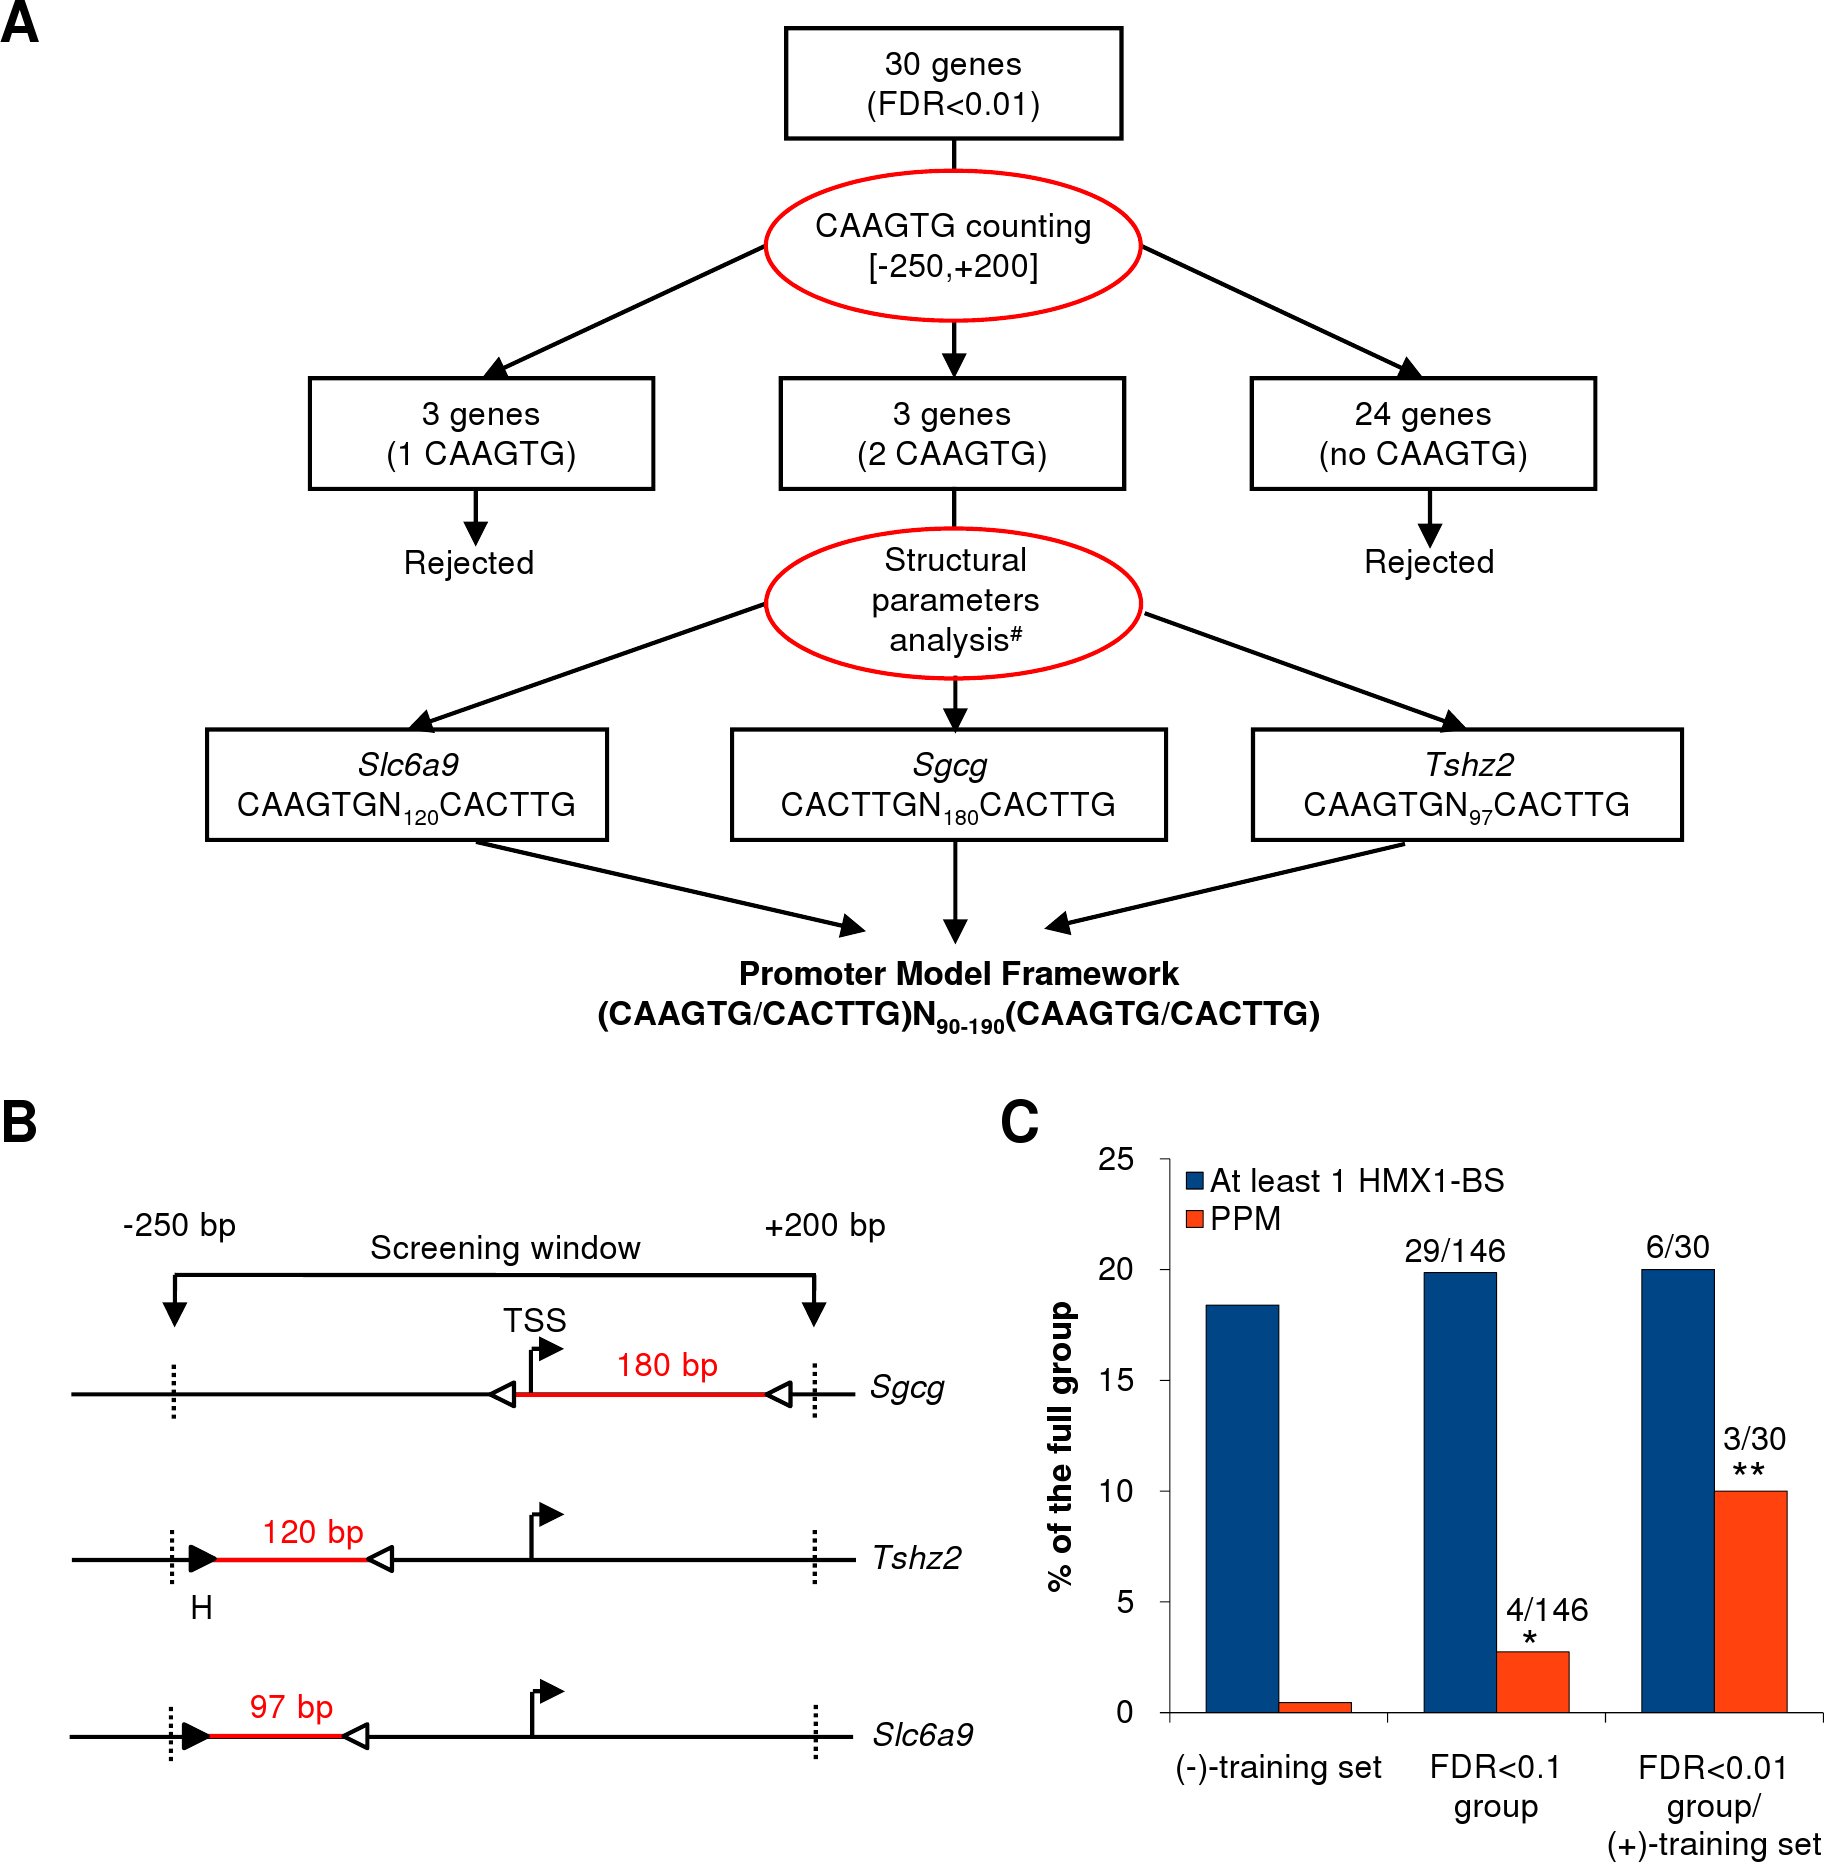
 Figure 2 of
Boulling, Mol Vis 2013; 19:1779-1794.
Figure 2 of
Boulling, Mol Vis 2013; 19:1779-1794.