Figure 1 of
Boulling, Mol Vis 2013; 19:1779-1794.
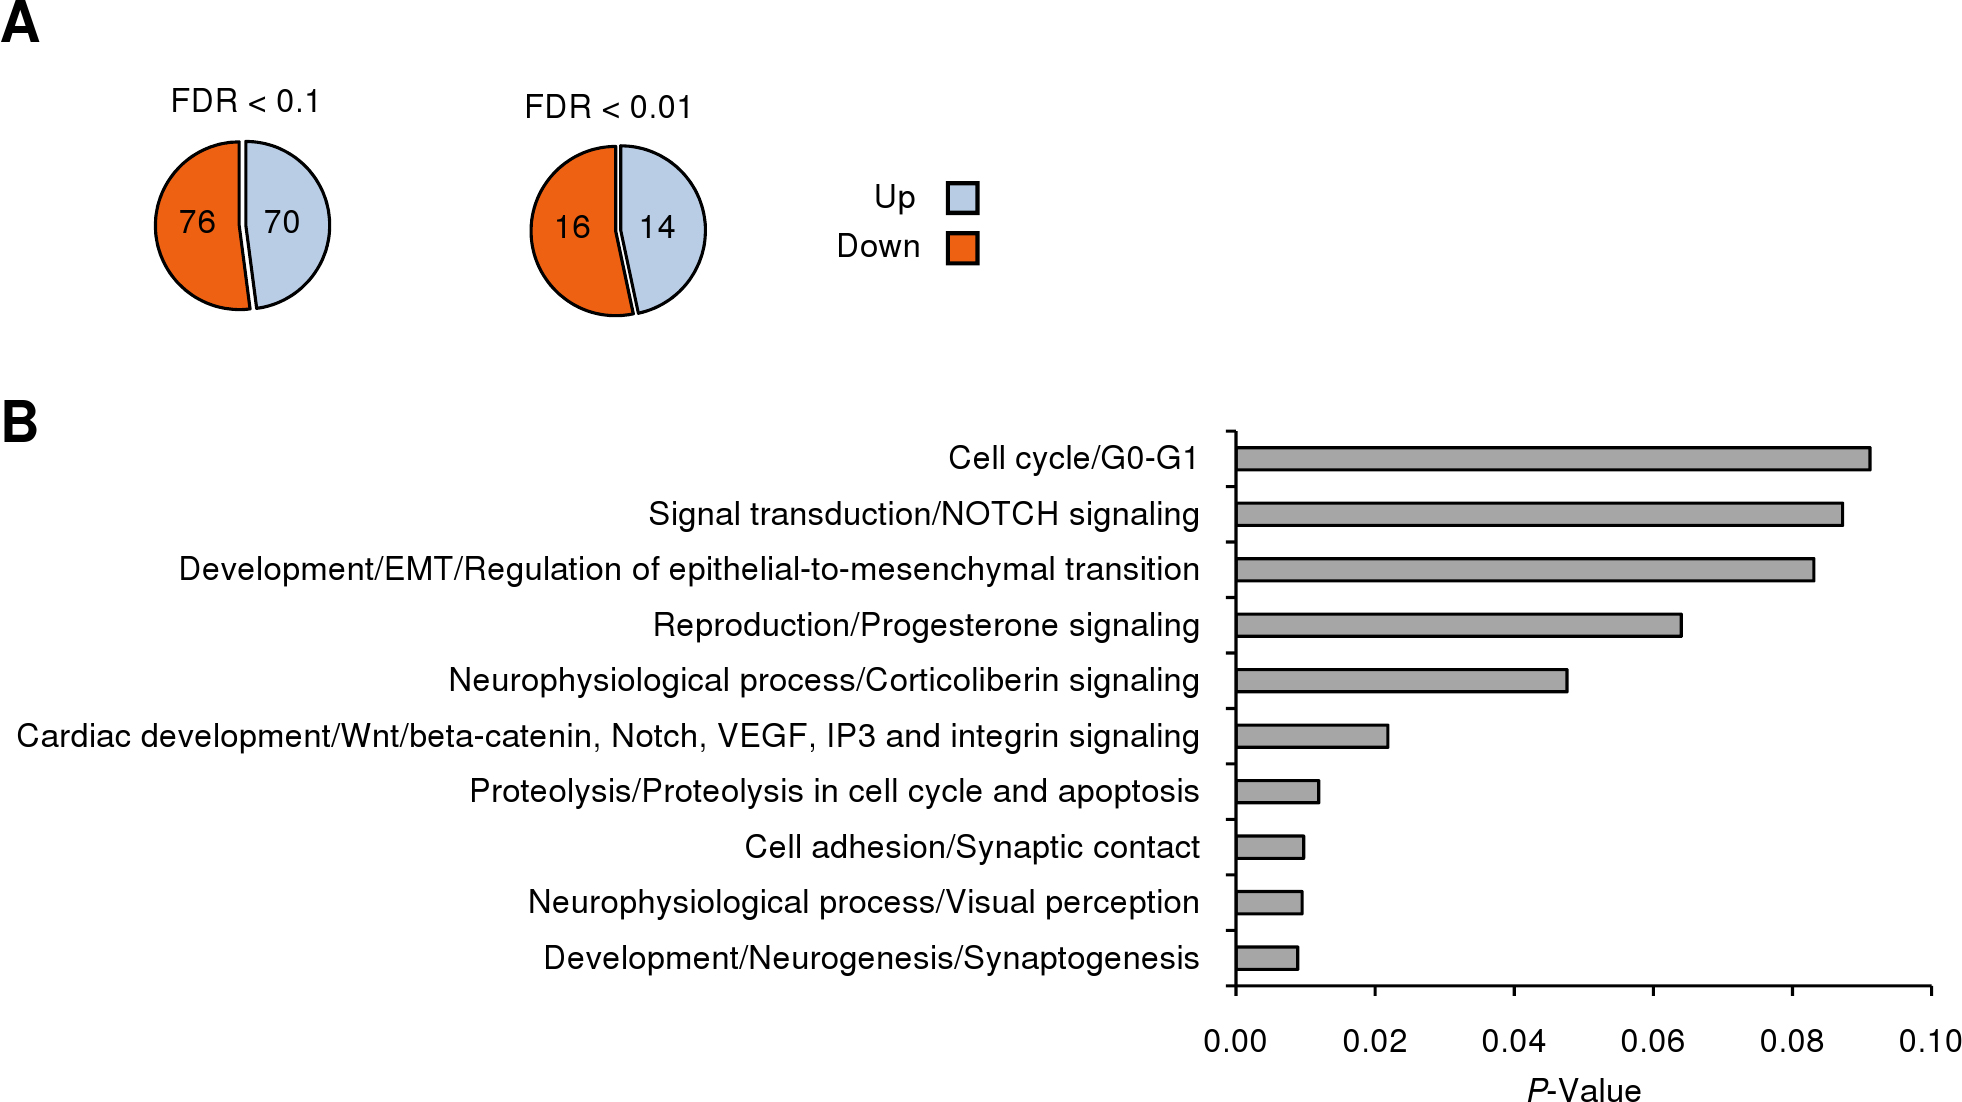
Figure 1.
Summary of microarray results.
A
: Up- and downregulated genes with a fold-change >1.2 and a FDR<0.1 or <0.01.
B
: MetaCore GeneGO Process Networks enrichment analysis of the FDR<0.1 group of differentially expressed genes.
 Figure 1 of
Boulling, Mol Vis 2013; 19:1779-1794.
Figure 1 of
Boulling, Mol Vis 2013; 19:1779-1794.