Figure 4. The expression of adiponectin and adiponectin receptors in the retina and the retinal pigment epithelium-choroid in mice with
type 1 diabetes mellitus. A: Picture illuminated APN protein levels in the retina and the RPE-choroid of the type 1 diabetes mellitus (T1DM) group and
the control group. The APN protein levels in the retina and the RPE-choroid of the T1DM group were higher than those in the
control group (n=8, *p<0.05). B: Picture illuminated the AdipoRs mRNA levels in the retina of the eNOS−/− mice control group and the eNOS−/− mice T1DM group. The AdipoR1 mRNA levels in the retina were significantly increased in the T1DM group compared to the control
group (n=11, ***p<0.001), but there was no obvious difference in the AdipoR2 mRNA levels between the T1DM group and the control
group. C: Picture illuminated the AdipoRs protein levels in the retina and the RPE-choroid in the control group mice and in the T1DM
group as determined with western blotting. D, E: Densitometry analysis showed that the AdipoRs protein was expressed in the control group and in the T1DM group. The AdipoR1
protein levels were higher in the T1DM group than in the control group in the retina and the RPE-choroid, and there was no
difference in the AdipoR2 protein in the retina and the RPE-choroid between the T1DM group and the control group (n=6, *p<0.05).
Data were shown as mean±SD.
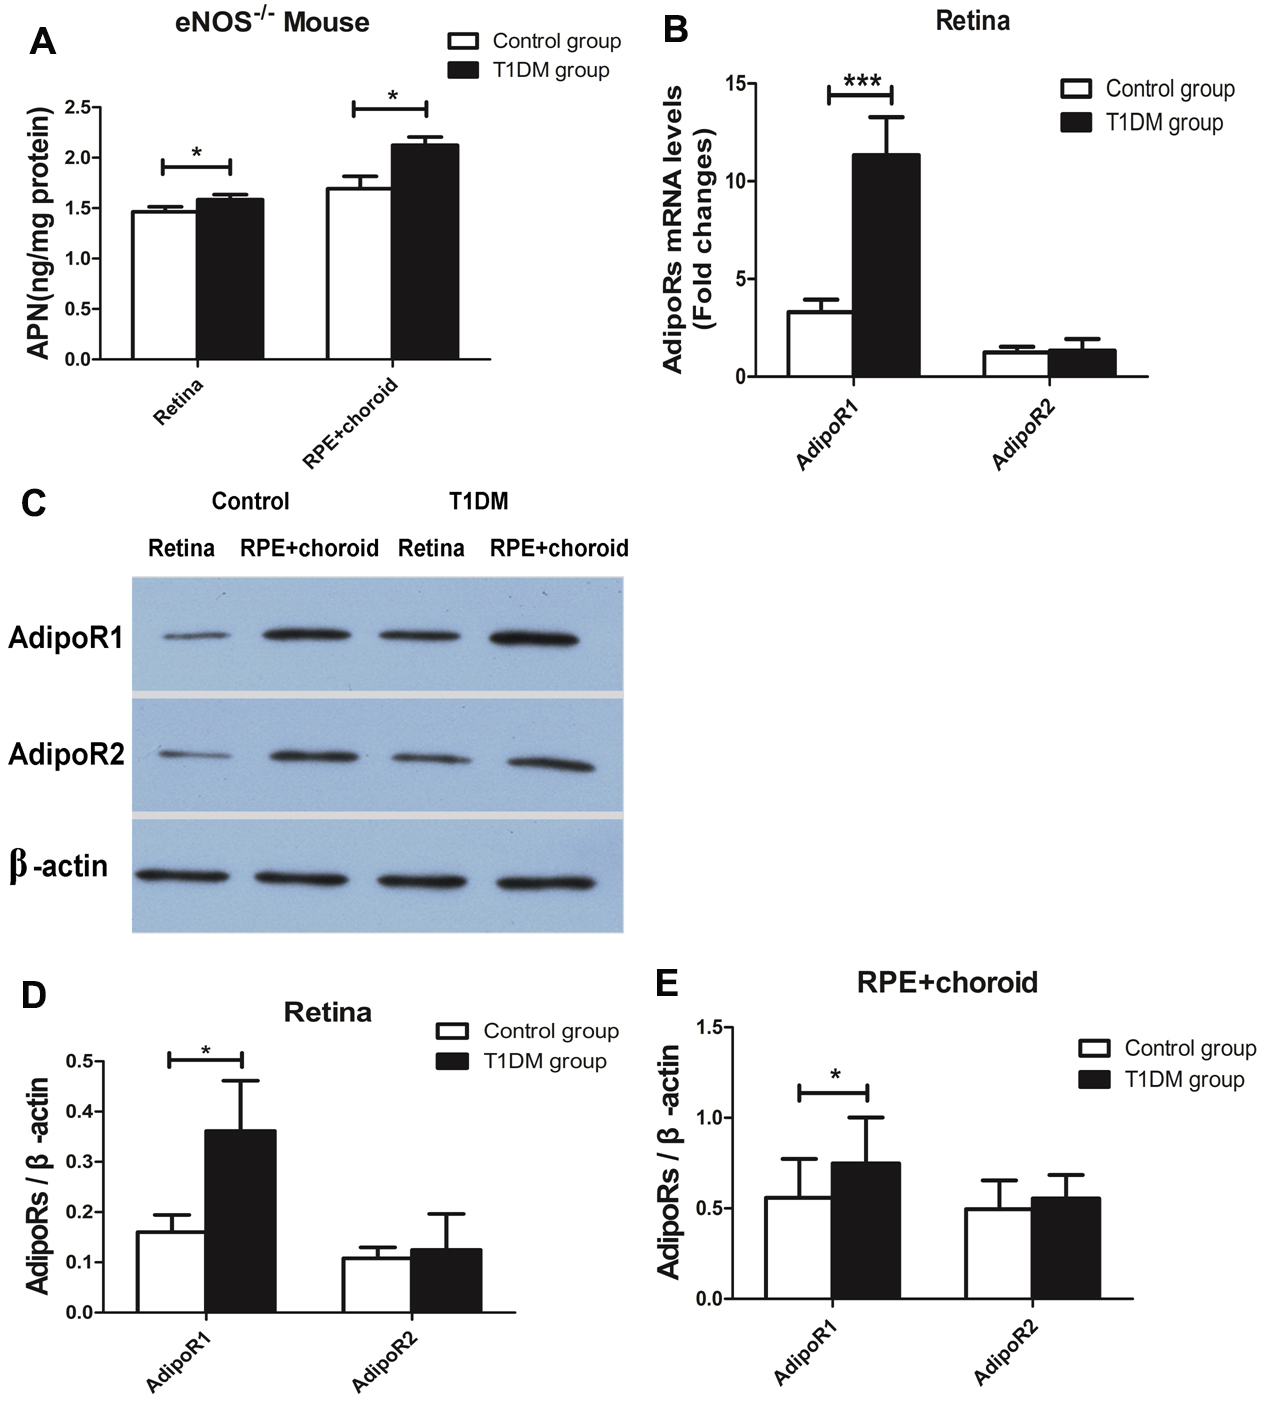
 Figure 4 of
Lin, Mol Vis 2013; 19:1769-1778.
Figure 4 of
Lin, Mol Vis 2013; 19:1769-1778.