Figure 2. Visual acuity in different grades of external limiting membrane (ELM) and inner segment-outer segment (IS-OS) junction disruption
in the different study groups. 27. Box and whisker plot showing visual acuity in the three grades of ELM and IS-OS junction
disruption in the study groups. A significant positive correlation was found between logMAR visual acuity and grade of disruption
(r=0.85, p<0.0001). Visual acuity decreased with increase in the grade of disruption of ELM and IS-OS junction. Data are shown
as upper and lower quartile, median and range. Grade 0: No Disruption; Grade 1: ELM disrupted IS-OS junction intact; Grade
2: Both ELM and IS-OS junction disrupted; Q1: upper quartile; Q3: lower quartile.
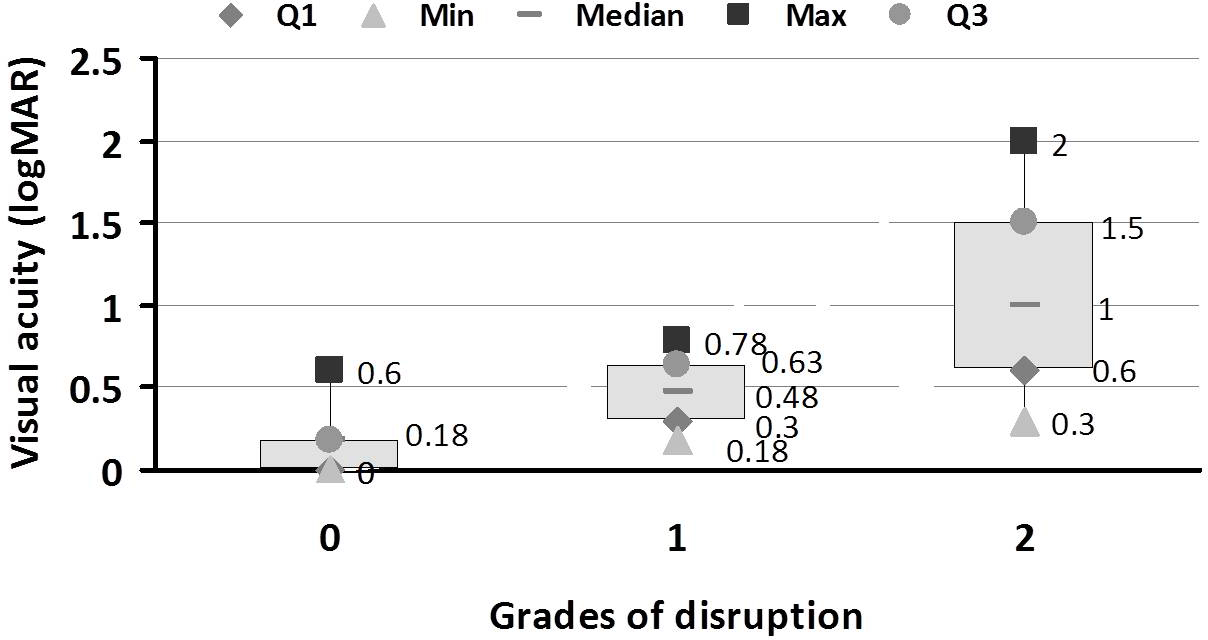
 Figure 2 of
Jain, Mol Vis 2013; 19:1760-1768.
Figure 2 of
Jain, Mol Vis 2013; 19:1760-1768.