Figure 1. Spectral domain optical coherence tomography (OCT) showing grades of external limiting membrane (ELM) and inner segment-outer
segment (IS-OS) junction disruption. Spectral domain OCT in A, B, and C showing no disruption of ELM (arrowhead) and IS-OS (arrow) , only ELM disruption with intact IS-OS and both ELM and IS-OS
disruption respectively. A: grade 0—no disruption of ELM (arrowhead) and IS-OS junction (arrow); B: grade 1—ELM disrupted, IS-OS junction intact; C: grade 2—both ELM and IS-OS junction disrupted.
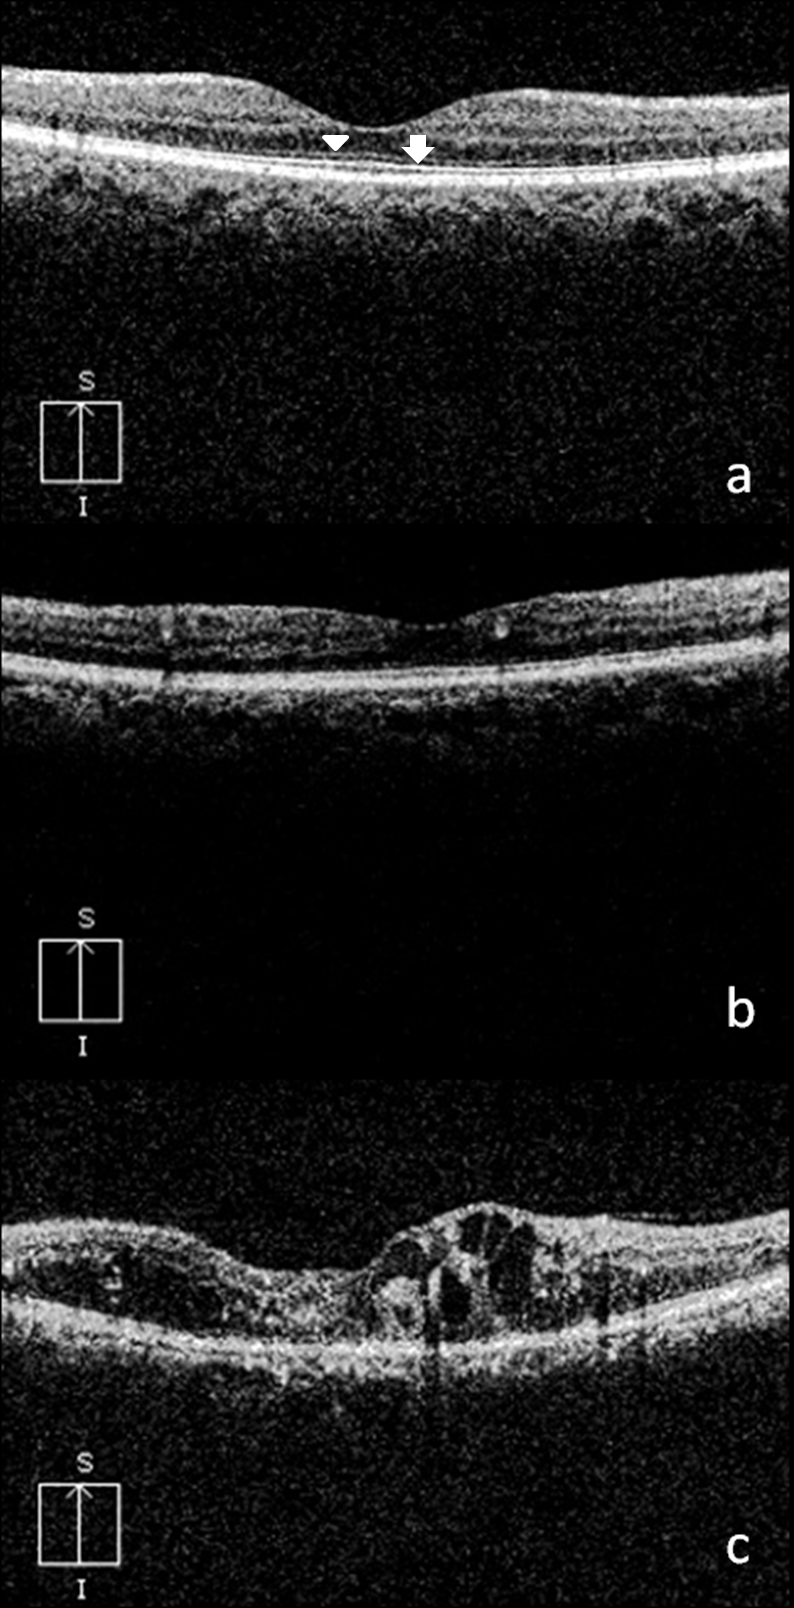
 Figure 1 of
Jain, Mol Vis 2013; 19:1760-1768.
Figure 1 of
Jain, Mol Vis 2013; 19:1760-1768.