Figure 7. Quantitative analysis of microglial morphology. Examination of the properties and shape of microglia in two dimensions (2D)
and three dimensions (3D) reveals significant differences between treatments. A: Neuroprotectin D1 (NPD1)-treated microglial cell areas and perimeters are significantly greater than controls. B: Microglial volumes and surface areas are significantly larger with NPD1 treatment. C,D: Morphological differences between treatments are readily apparent from representative maximum intensity projections (C) and 3D renderings (D); insets tabulate the values of the respective 2D and 3D shape descriptors (S: solidity). For 2D projections, the XY projection
is shown centrally, with the XZ projection below and the YZ projection to the right. E: Quantitative analysis of shape descriptors using classic 2D maximum XY projections reveal significant differences in form
factor (F), convexity (C), and fractal dimension (D) between treatments when analyzed using 2D maximum XY projections. The
3D shape descriptors reveal that NPD1 treatment significantly reduces the form factor and significantly increases the fractal
dimension. For Control, n=33; for NPD1, n=24; for total observations, n=50; and degrees of freedom = 55.
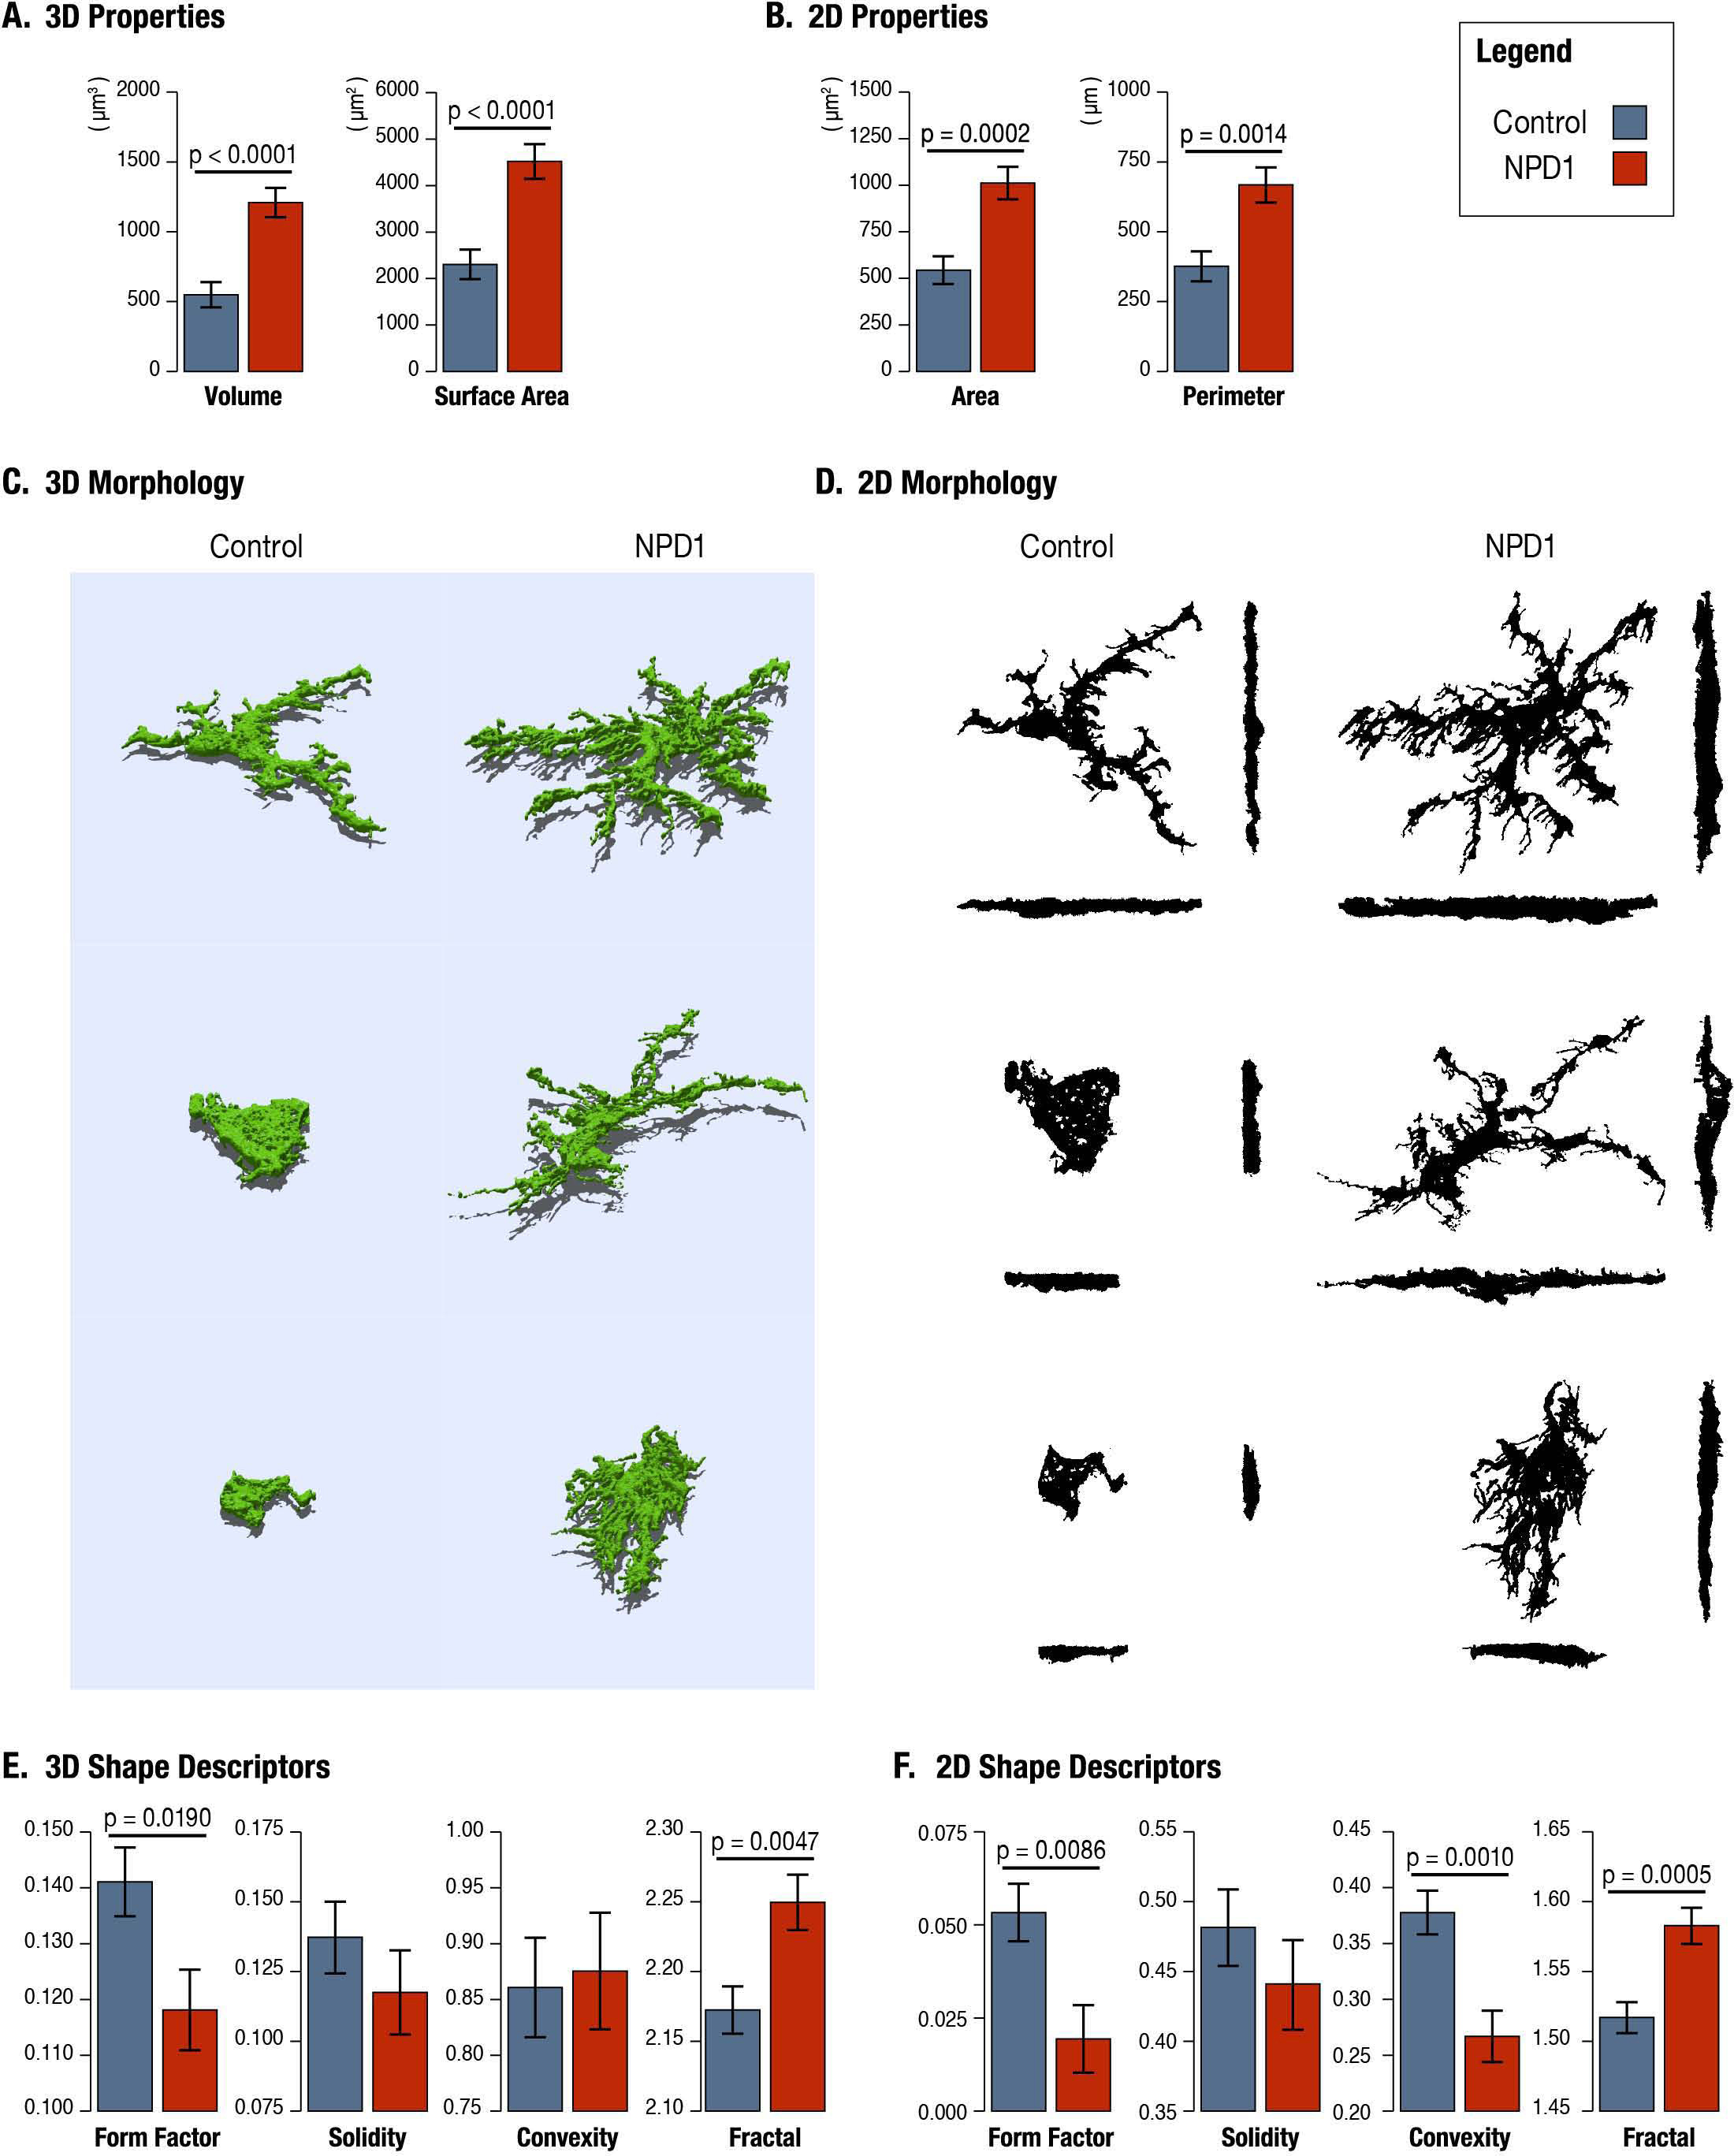
 Figure 7 of
Sheets, Mol Vis 2013; 19:1747-1759.
Figure 7 of
Sheets, Mol Vis 2013; 19:1747-1759.