Figure 6. Microglial distribution in control and neuroprotectin D1-treated eyes. A: Lesion sectors from control and neuroprotectin D1 (NPD1)-treated eyes of the same animal highlight the differences in microglial
distribution between treatments. B: The quantity of peripheral microglia per lesion sector was similar between treatments, but the spatial distribution was
significantly different, with NPD1-treated microglia clustering 51% closer to the lesion perimeter than controls. The microglia
count per sector is as follows: for Control, n=17; for NPD1, n=16; for total observations, n=3; and degrees of freedom = 31.
The microglia distribution is as follows: for Control, n=503; for NPD1, n=462; for total observations, n=965; and degree of
freedom = 933. C: An idealized schematic of a lesion sector illustrates a central lesion (black ring) with a ring for each treatment, representing
the mean distance of microglia to the lesion perimeter.
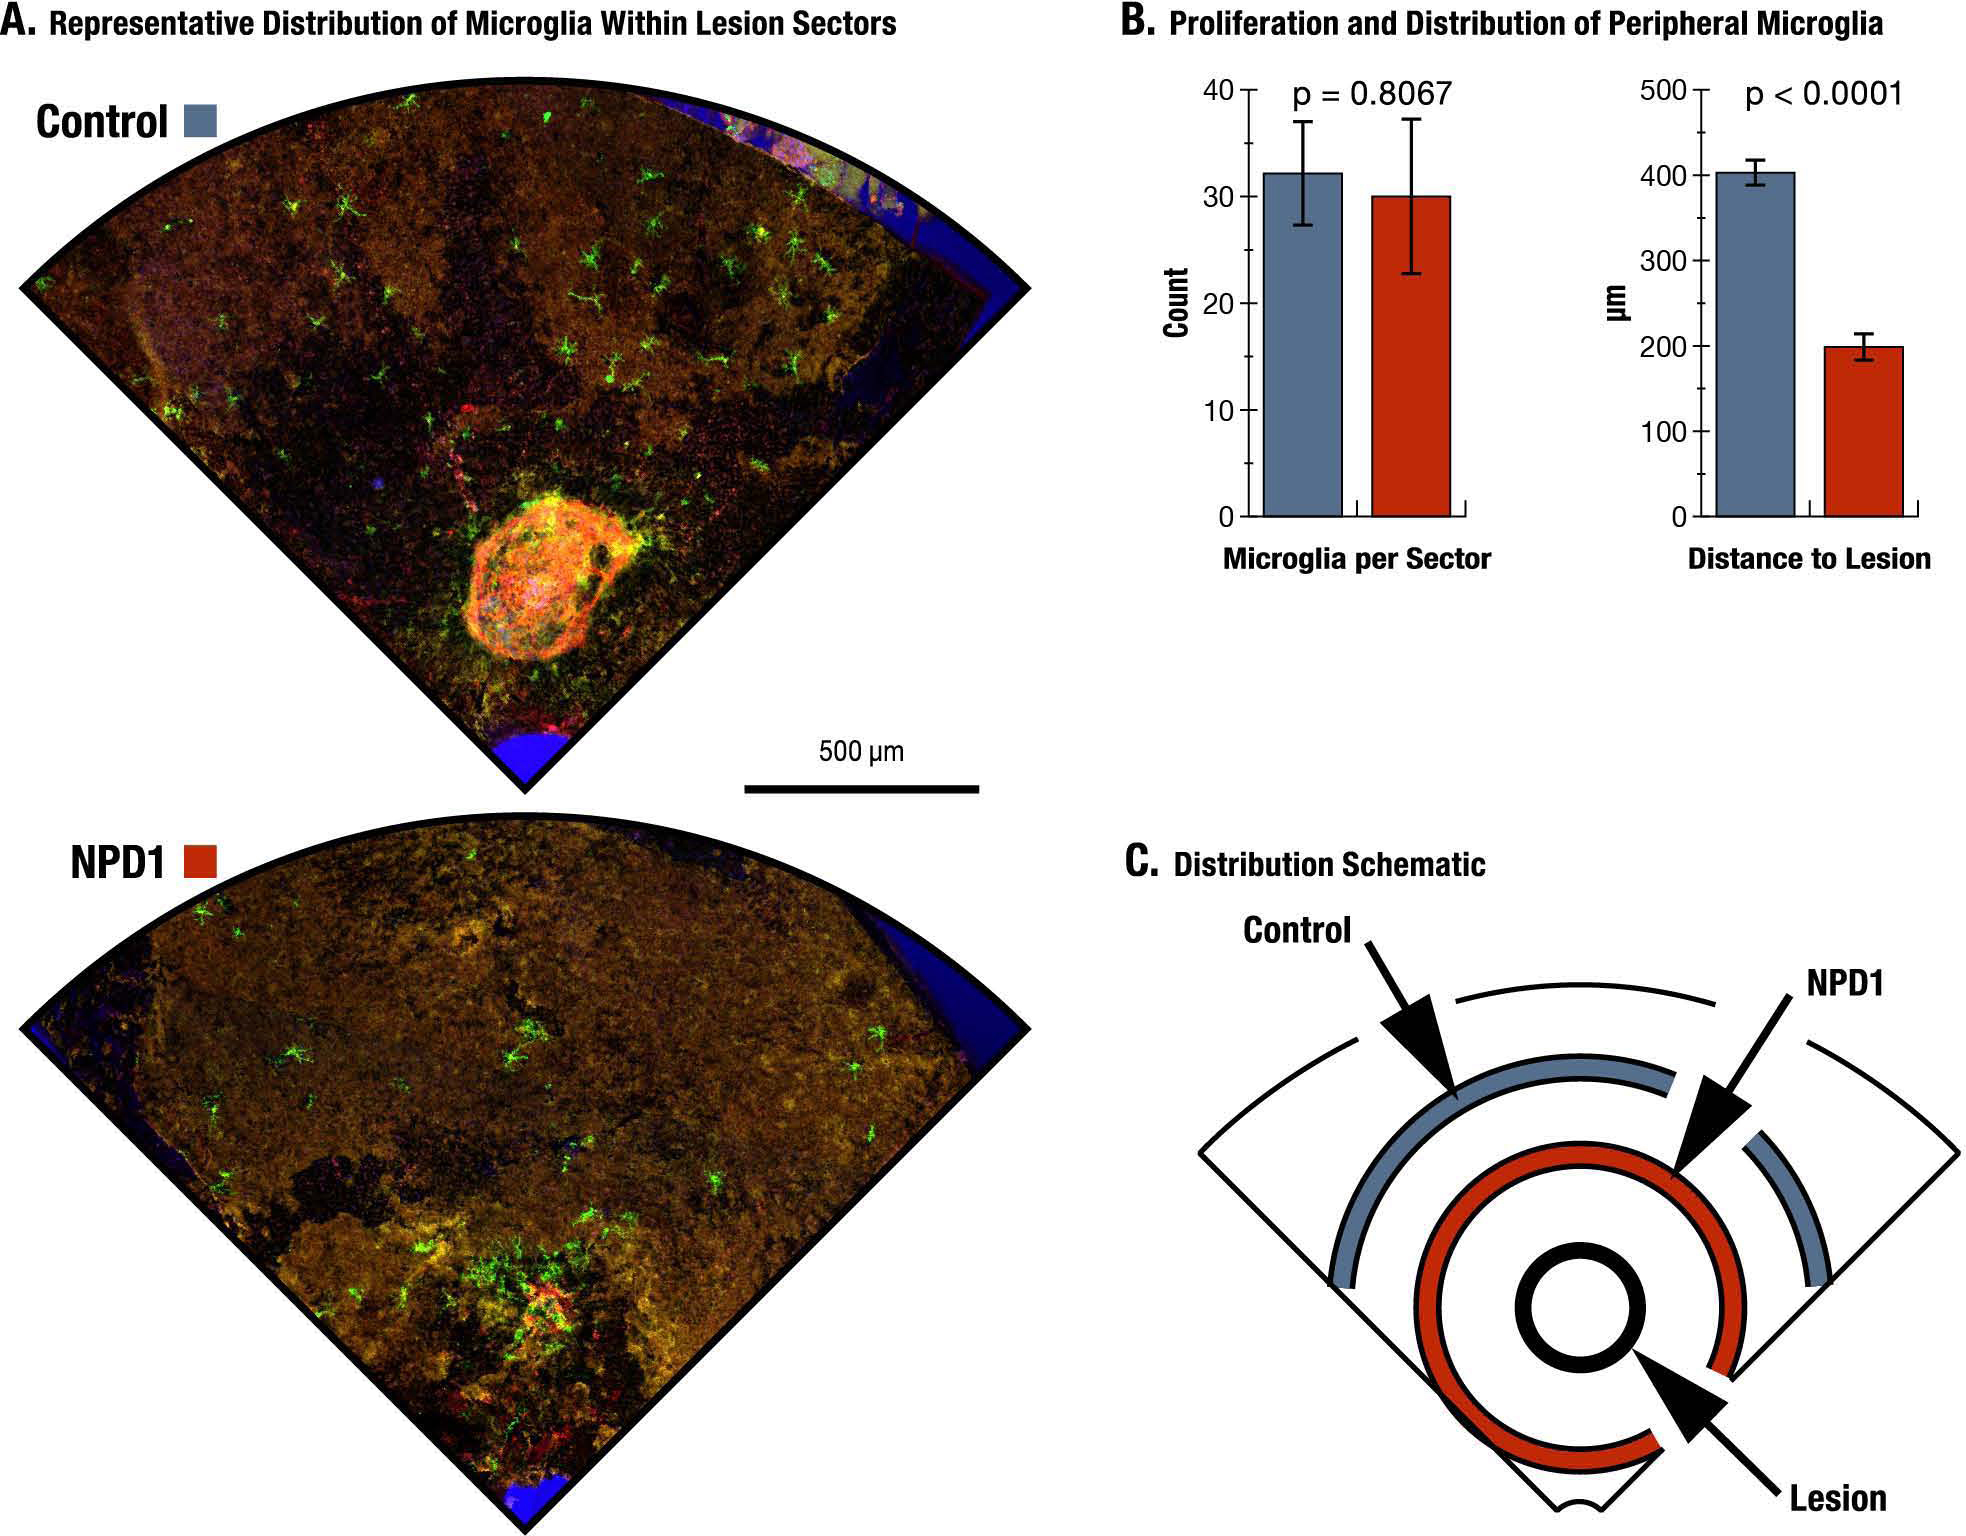
 Figure 6 of
Sheets, Mol Vis 2013; 19:1747-1759.
Figure 6 of
Sheets, Mol Vis 2013; 19:1747-1759.