Figure 4. Comparison of fluorescein leakage. A: Representative fluorescein angiograms of control and neuroprotectin D1 (NPD1)-treated eyes from the same animal at 7 and
14 days post laser are shown. The arrowheads illustrate an annular fluorescein void surrounding choroidal neovascularization
(CNV) lesions. Increases of fluorescein intensity with time are clearly evident in both treatments, but are significantly
higher in control lesions than in NPD1 lesions. B: The results of quantitative image analysis at 7 days post laser indicate that NPD1 treatment significantly reduced the area,
intensity, and integrated density of leakage. C: At 14 days post laser, 1 week after cessation of treatment, NPD1-induced reductions in leakage area and integrated density
were sustained. For Control, n=87; for NPD1, n=81; for total observations, n=168; and degrees of freedom = 111.
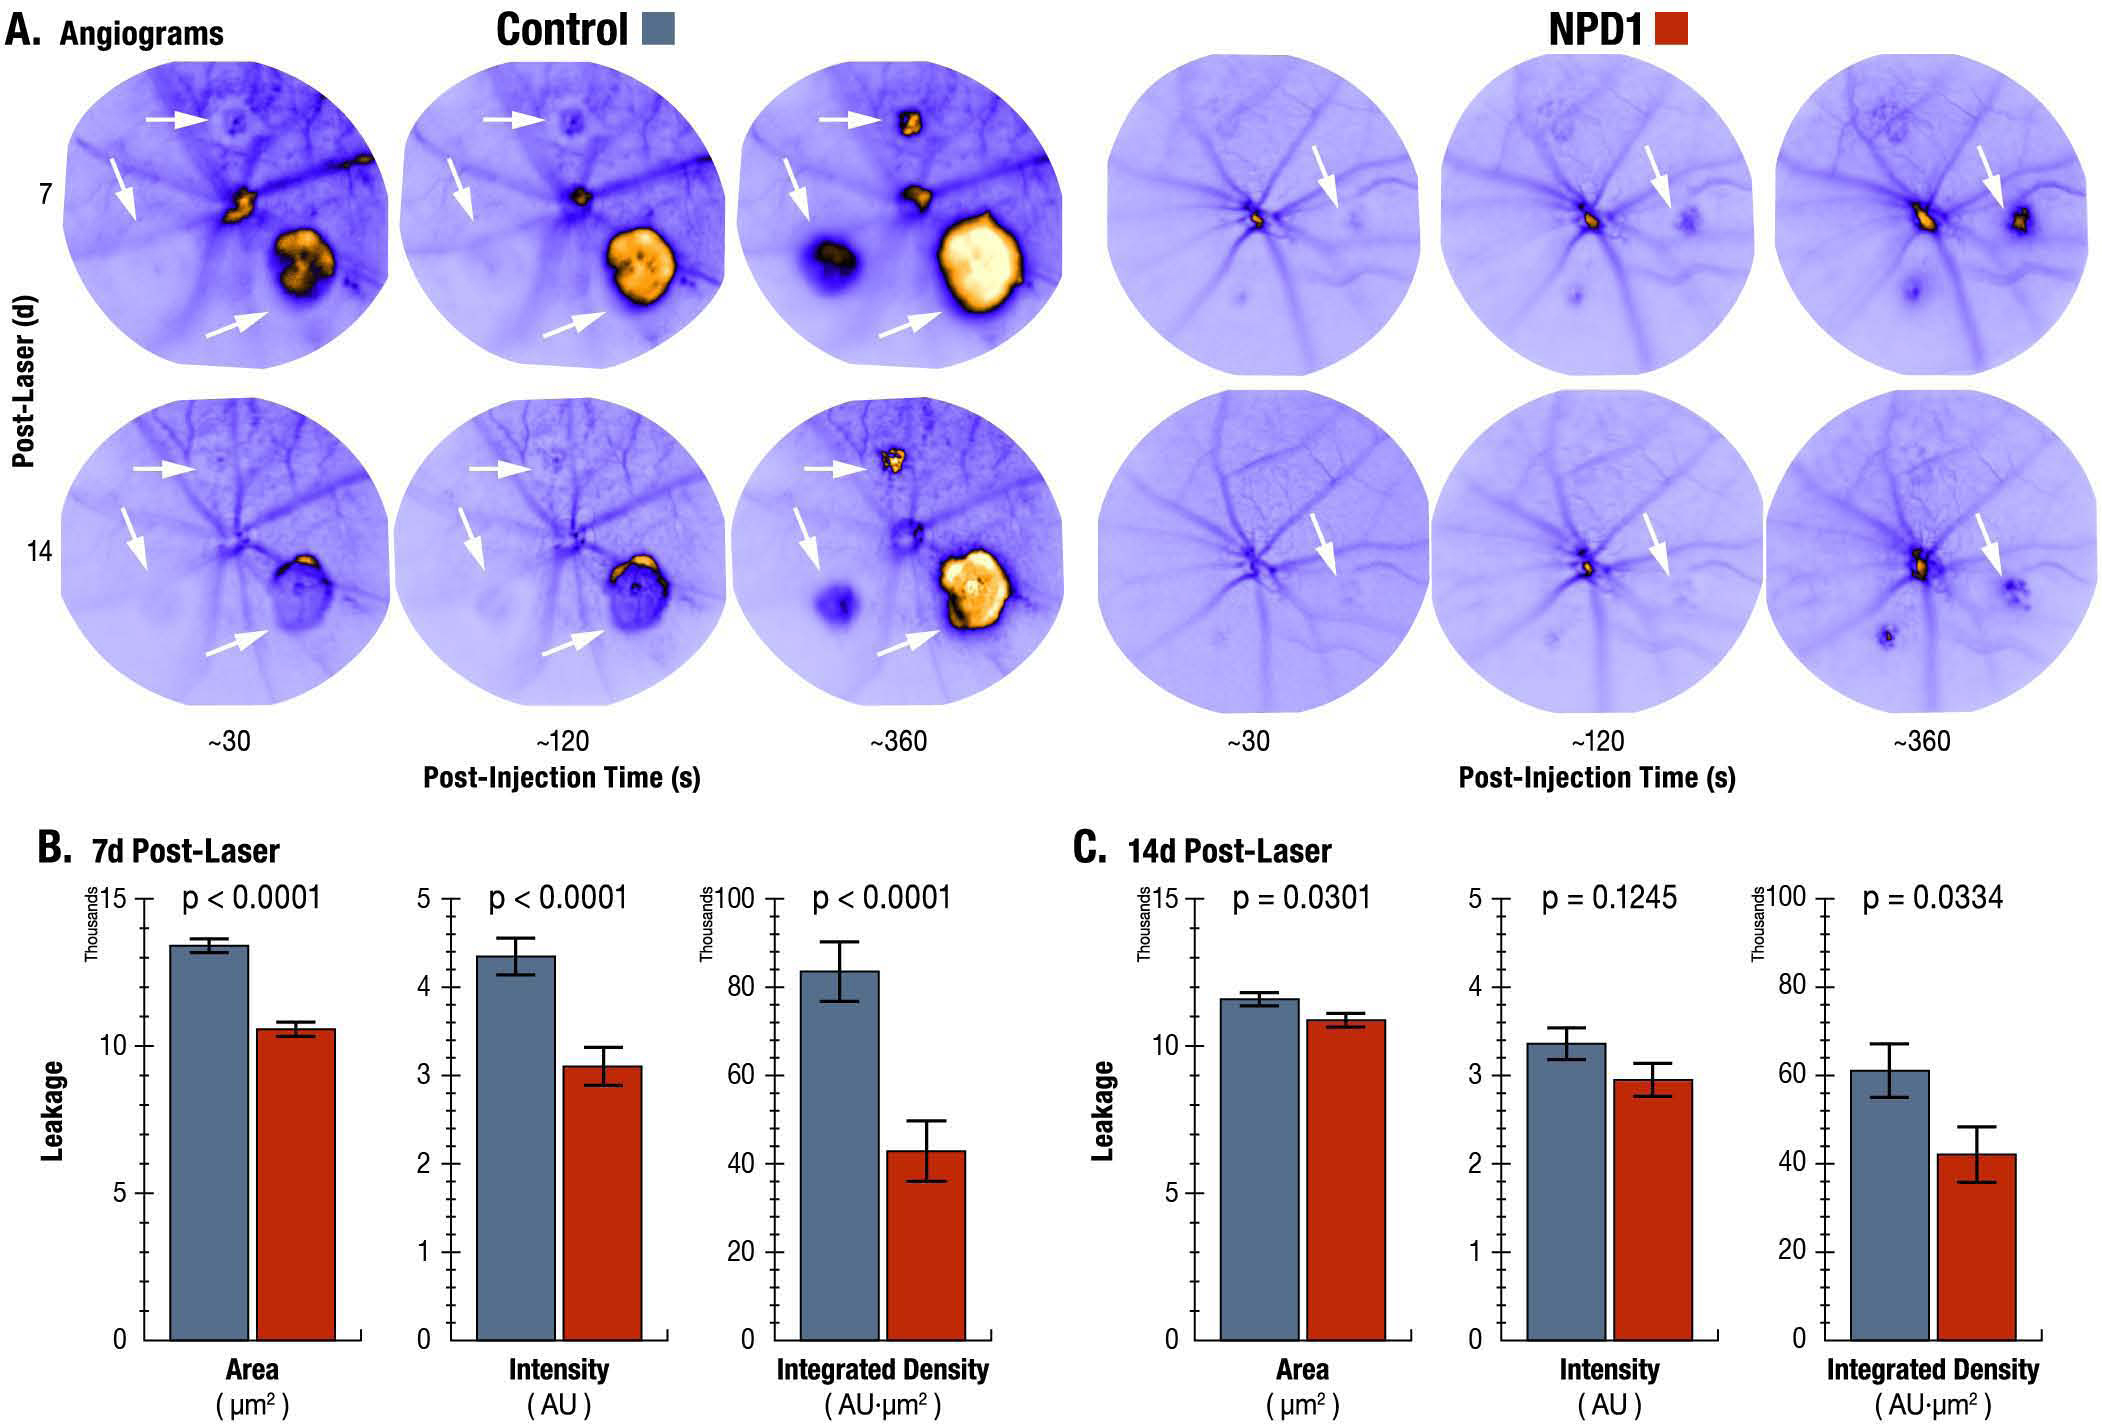
 Figure 4 of
Sheets, Mol Vis 2013; 19:1747-1759.
Figure 4 of
Sheets, Mol Vis 2013; 19:1747-1759.