Figure 3. Mass spectrometry and neuroprotectin D1 delivery to retina by topical corneal application. A: Sample chromatograms illustrate the presence of deuterated neuroprotectin D1 (NPD1-d2) in ipsilateral retina 2 h after topical
application, but not contralateral retina (bottom inset). Structural schematics of the selected reaction monitoring (SRM)
for NPD1 (m/z 359 to 206) and NPD1-d2 (m/z 361 to 208) are shown at the right of each chromatogram. B: Retinal tissue concentration versus time post application of NPD1-d2 reveals a sustained peak near 2 h. The NPD1-d2 spike
at 0 h most likely results from aqueous humor contamination of tissue samples due to the extraction method. C: NPD1-d2 concentration normalized to the mass of topically applied NPD1-d2. For Control, n=87; for NPD1, n=81; for total
observations, n=168; and degrees of freedom = 111.
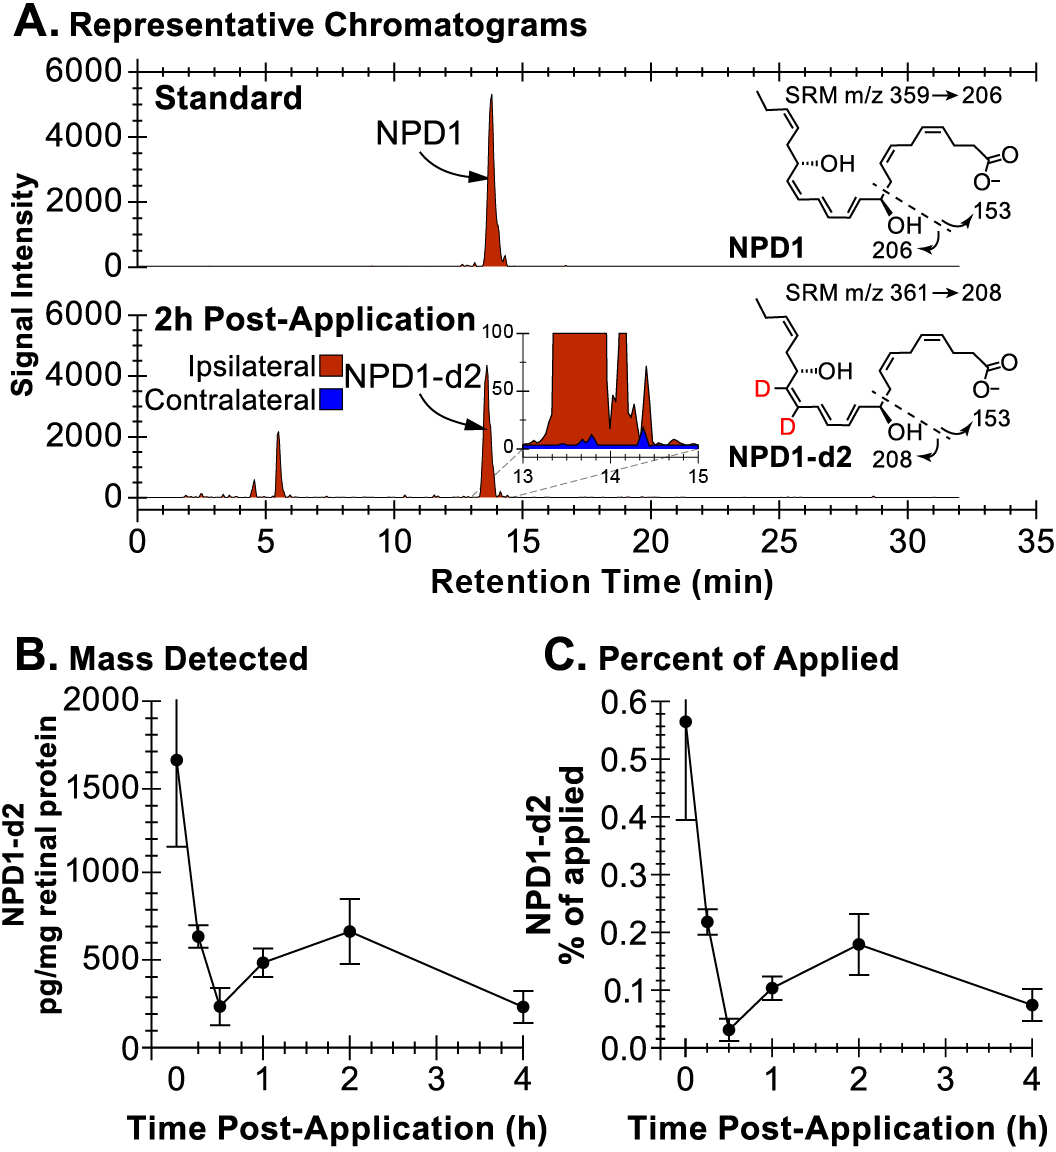
 Figure 3 of
Sheets, Mol Vis 2013; 19:1747-1759.
Figure 3 of
Sheets, Mol Vis 2013; 19:1747-1759.