Figure 2. Angiogram processing. Raw images in an angiogram time series are captured unaligned and with arbitrary gain values. A: Gain values are reduced over time to accommodate increasing lesion intensity, thereby concealing the majority of fluorescein
changes between phases. B: Registered and normalized angiograms reveal a clear time-dependent accumulation of fluorescein within lesions. Note that
vascular fluorescein intensity remains stable across phases. C: An overlay of the phases illustrates the accuracy of registration using scale invariant feature transform (SIFT) alignment.
D: A surface plot visualizes the integrated density (area multiplied by intensity) of lesion regions of interest (ROIs). Fluorescein
intensity is plotted along the Z dimension and the ROI boundary lies on the XY plane. The volume of the extruded cone is equivalent
to integrated density, which clearly increases over time.
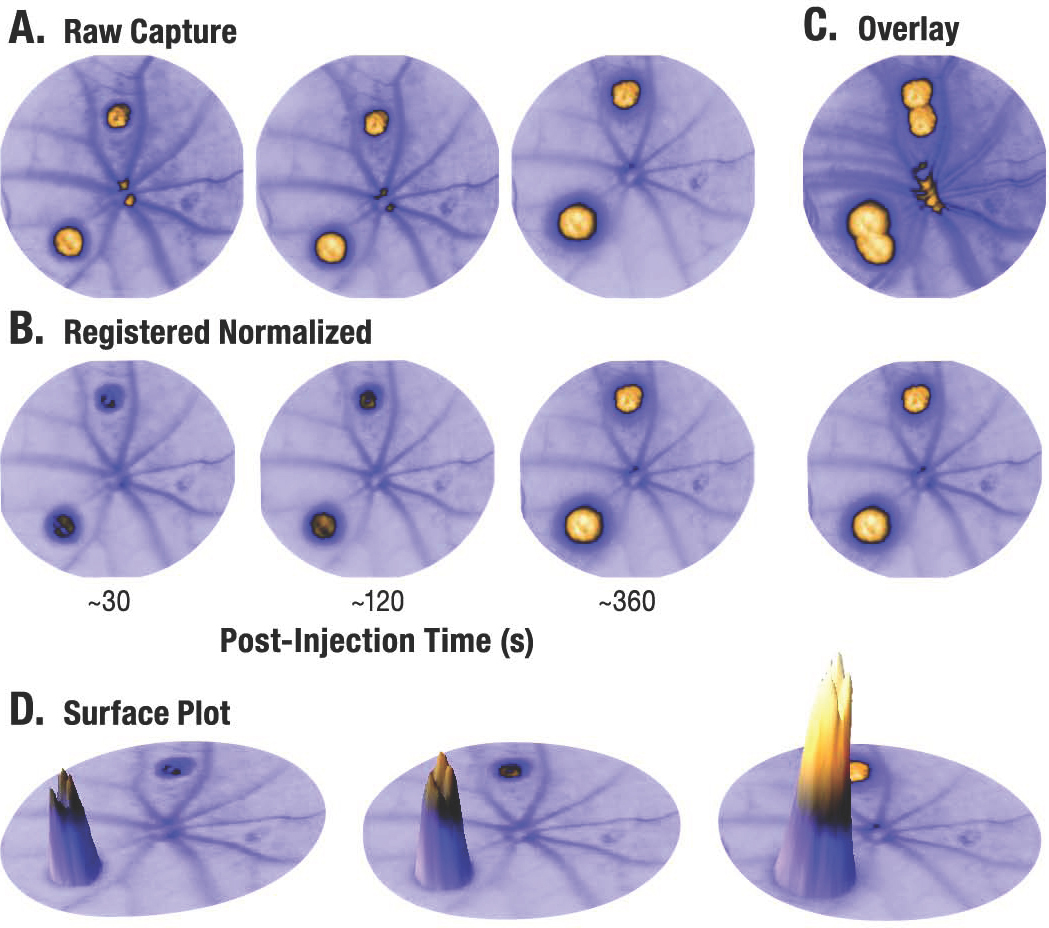
 Figure 2 of
Sheets, Mol Vis 2013; 19:1747-1759.
Figure 2 of
Sheets, Mol Vis 2013; 19:1747-1759.