Figure 5. The levels of reduced glutathione and sulfhydryl content in lens. A: The levels of reduced glutathione in lenticular samples of the 26-day-old rat pups in various experimental groups (n=6).
B: The levels of total sulfhydryl content in lenticular samples of the 26-day-old rat pups in various experimental groups (n=6).
Group A: Rat pups received only saline. Group B: Rat pups received only selenite. Group C: Rat pups received selenite and
hydrogen saline. Values are expressed as mean±standard deviation (SD). Statistical analysis of the data was subject to one-way
analysis of variance (ANOVA) followed by the least significant difference (LSD) test. * Compared with Group A: p<0.05. # Compared
with Group B: p<0.05.
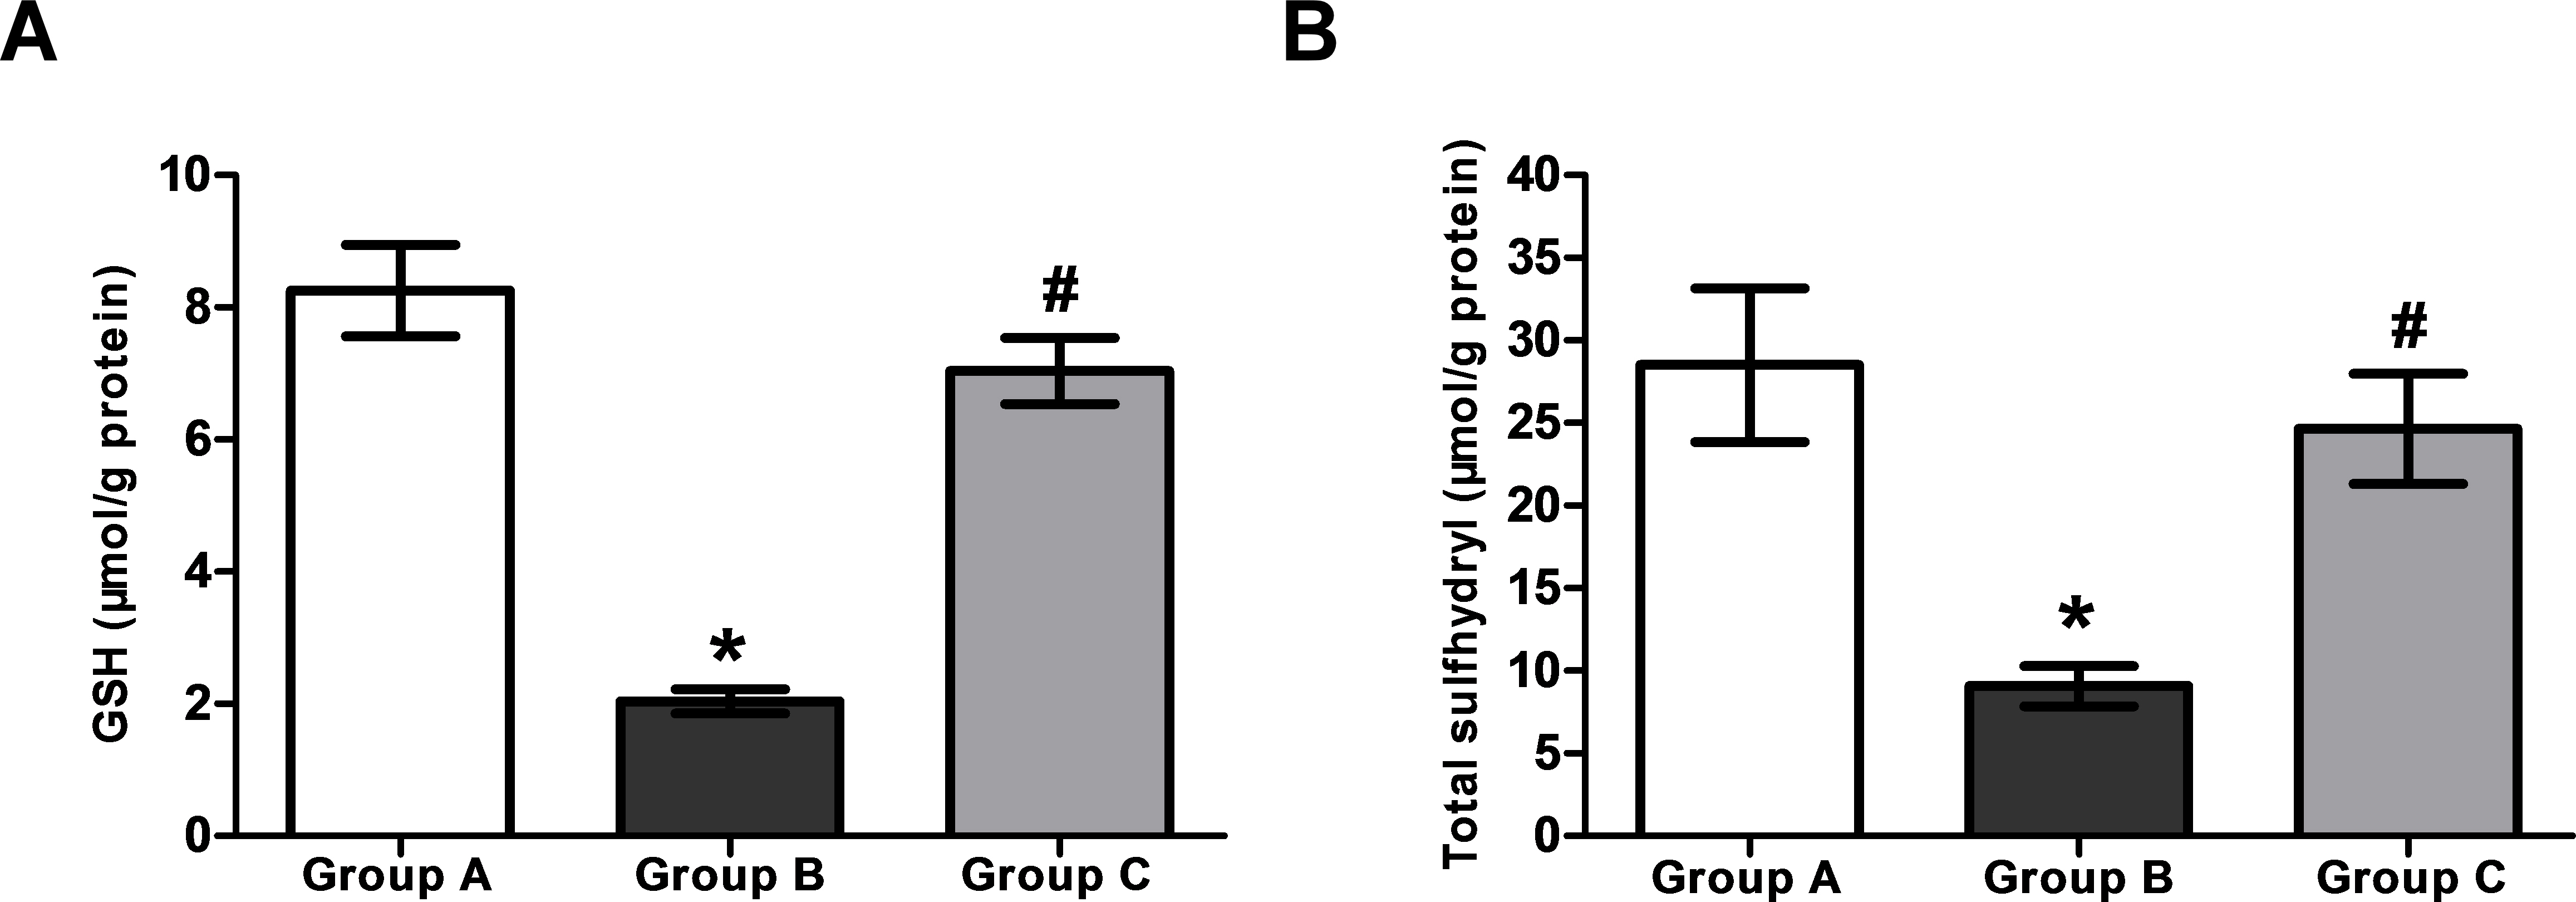
 Figure 5 of
Yang, Mol Vis 2013; 19:1684-1693.
Figure 5 of
Yang, Mol Vis 2013; 19:1684-1693.