Figure 3. The activities of antioxidant enzymes in lenticular samples of the 26-day-old rat pups in various experimental groups. Group
A: Rat pups received only saline. Group B: Rat pups received only selenite. Group C: Rat pups received selenite and hydrogen
saline. A: The activity of superoxide dismutase (SOD) in lens (n=9). B: The activity of catalase (CAT) in lens (n=9). C: The activity of glutathione peroxidase (Gpx) in lens (n=6). D: The activity of glutathione reductase (GR) in lens (n=9). E: The activity of glutathione S- transferase (GST) in lens (n=9). Values are expressed as mean±standard deviation (SD). Statistical
analysis of the data was subject to one-way analysis of variance (ANOVA) followed by the least significant difference (LSD)
test. * Compared with Group A: p<0.05. # Compared with Group B: p<0.05.
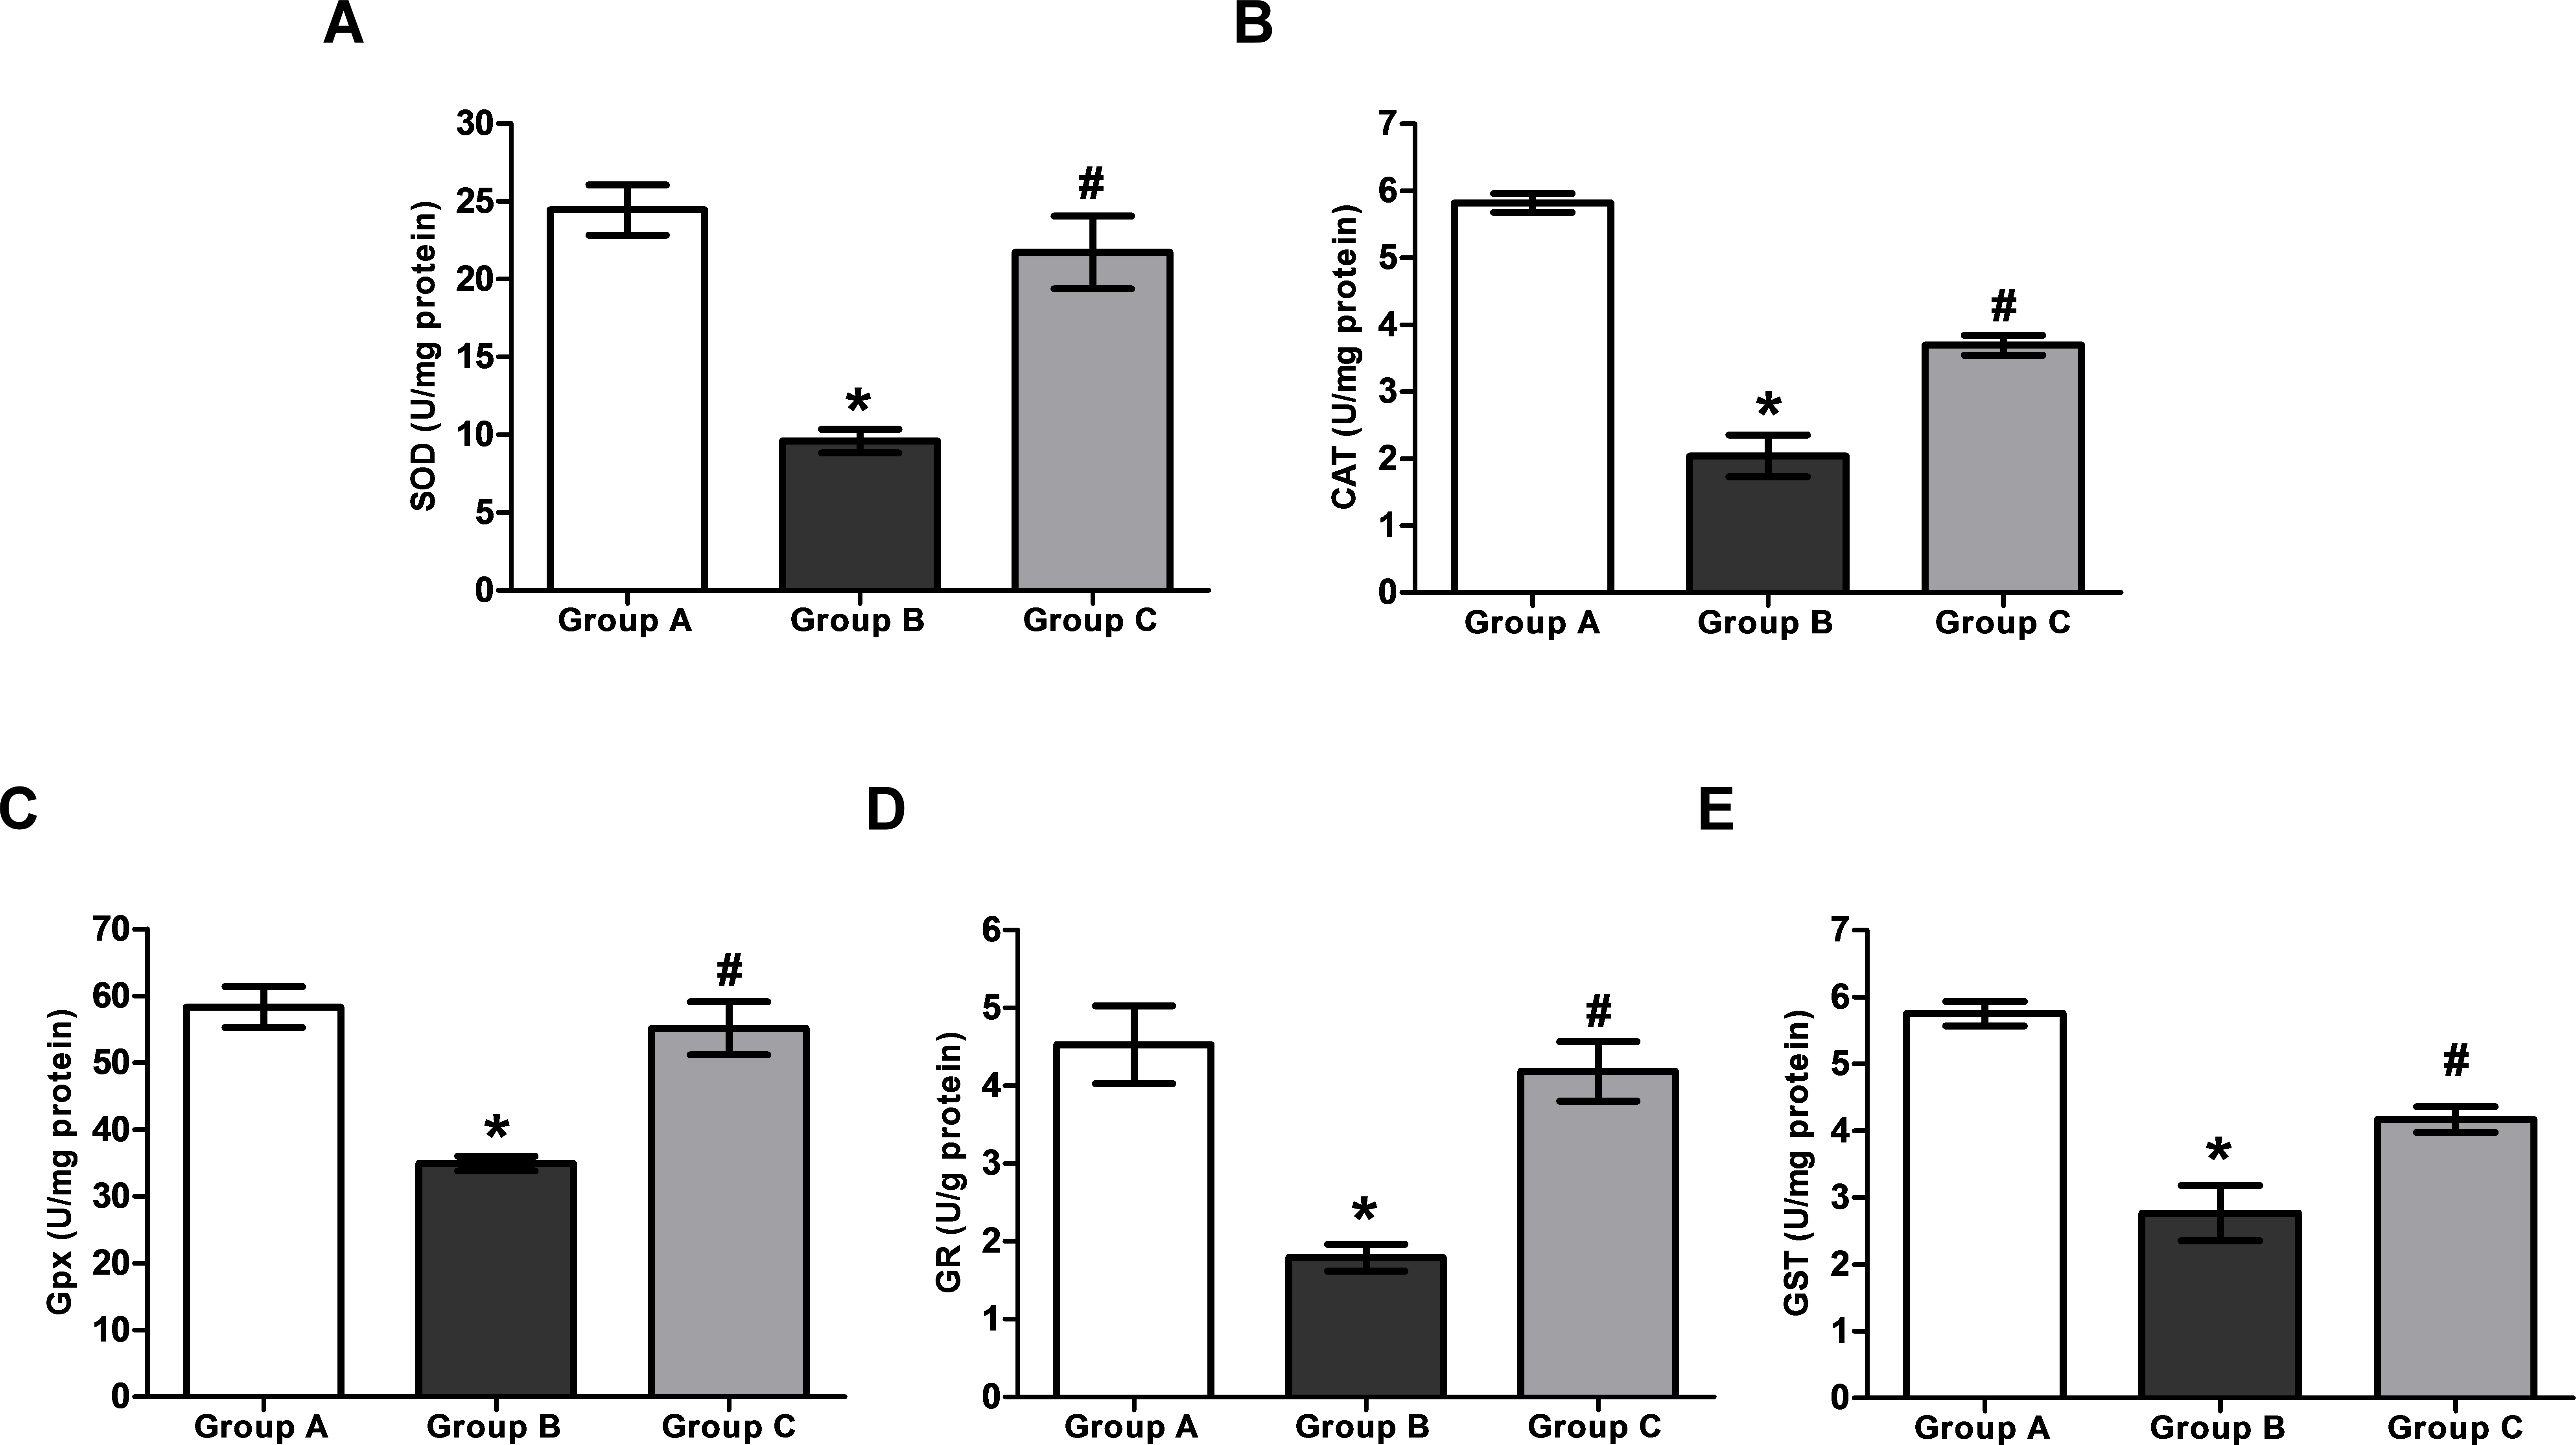
 Figure 3 of
Yang, Mol Vis 2013; 19:1684-1693.
Figure 3 of
Yang, Mol Vis 2013; 19:1684-1693.