Figure 4. The relationship between lymphatic microvessel density, blood microvessel density, and recurrence time in different recurrent
cases. A: Scatter distribution of recurrence time (RT) in different grades of pterygium was with best fit lines for lymphatic microvessel
density (LMVD) in each grade. B: Scatter distribution of RT in all cases was with a fit line for total LMVD. C: Scatter distribution of RT in different grades of pterygium was with best fit lines for blood microvessel density (BMVD)
in each grade, but the fit line for total BMVD did not exist.
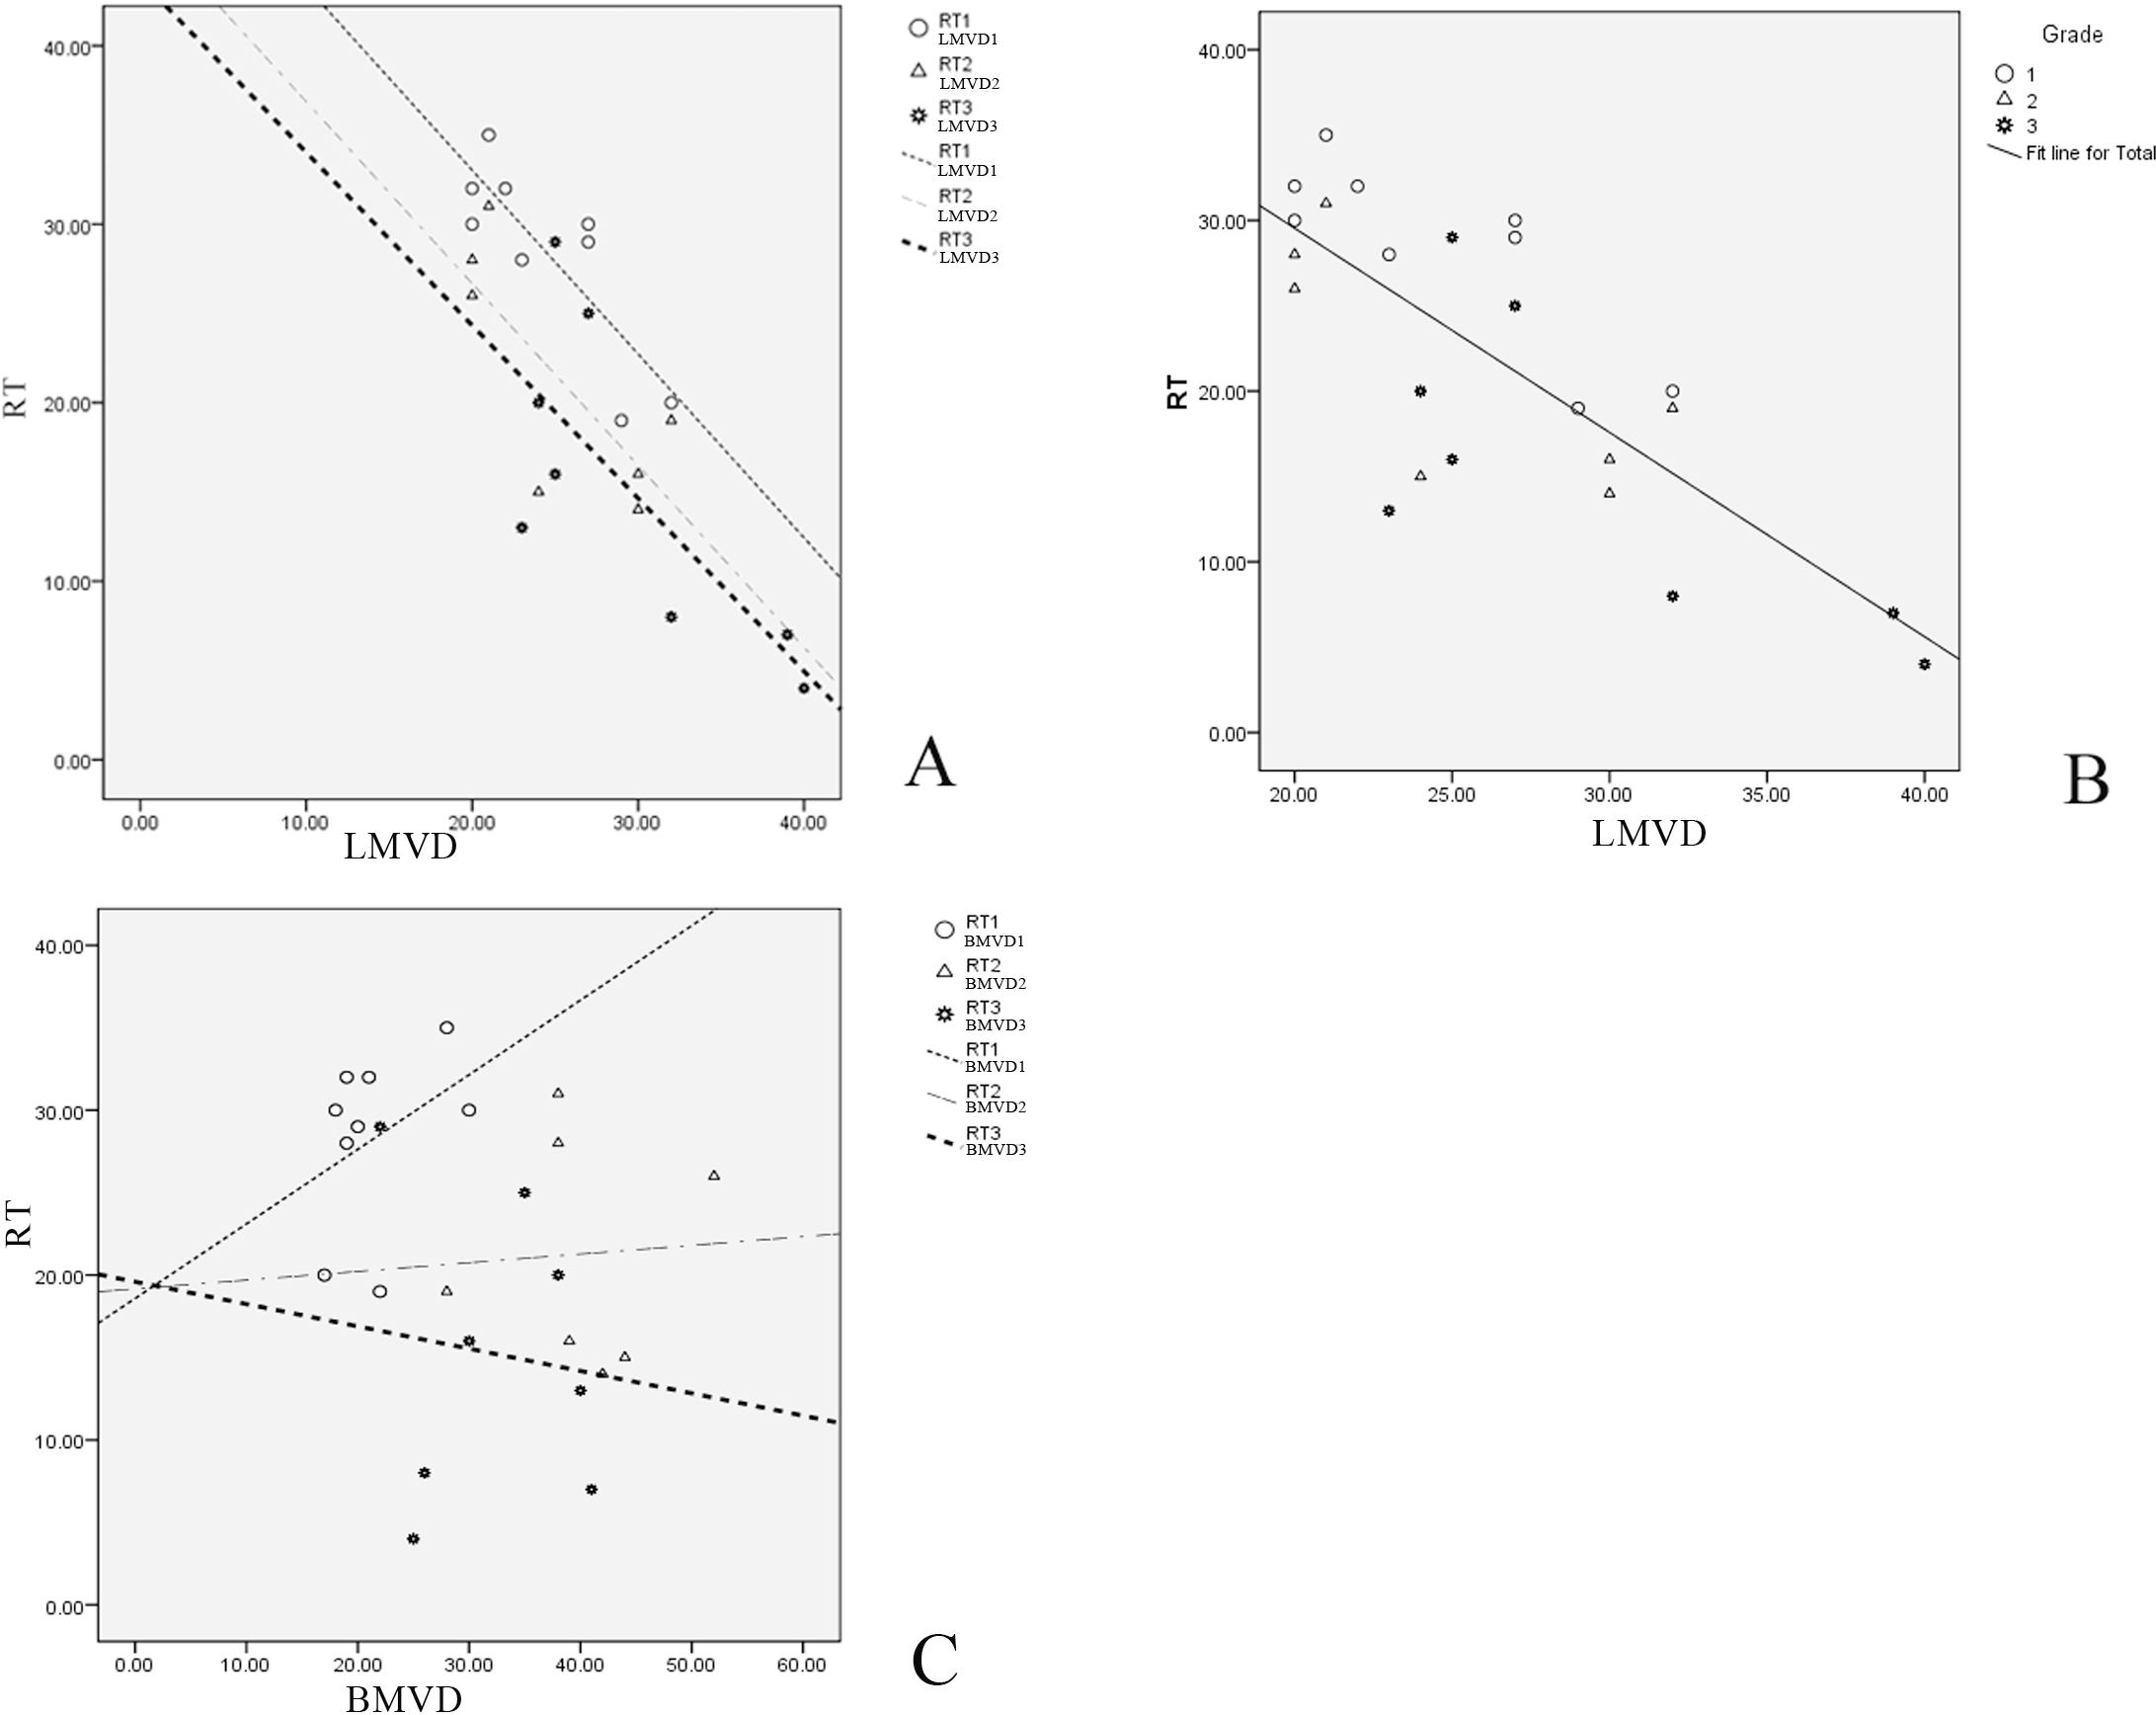
 Figure 4 of
Lin, Mol Vis 2013; 19:166-173.
Figure 4 of
Lin, Mol Vis 2013; 19:166-173.