Figure 6. Astaxanthin increased expression of NQO1, GCLM, HO-1 and GCLC protein. A: Cells were treated with 5, 10, and 20 µM astaxanthin (AST) for 24 h. Western blot analysis was performed using the corresponding
antibodies. B: Quantitative analysis of the relative protein levels in the ARPE-19 cells. Data are shown as mean ± standard deviation (SD)
(n=6); *p<0.05 versus control.
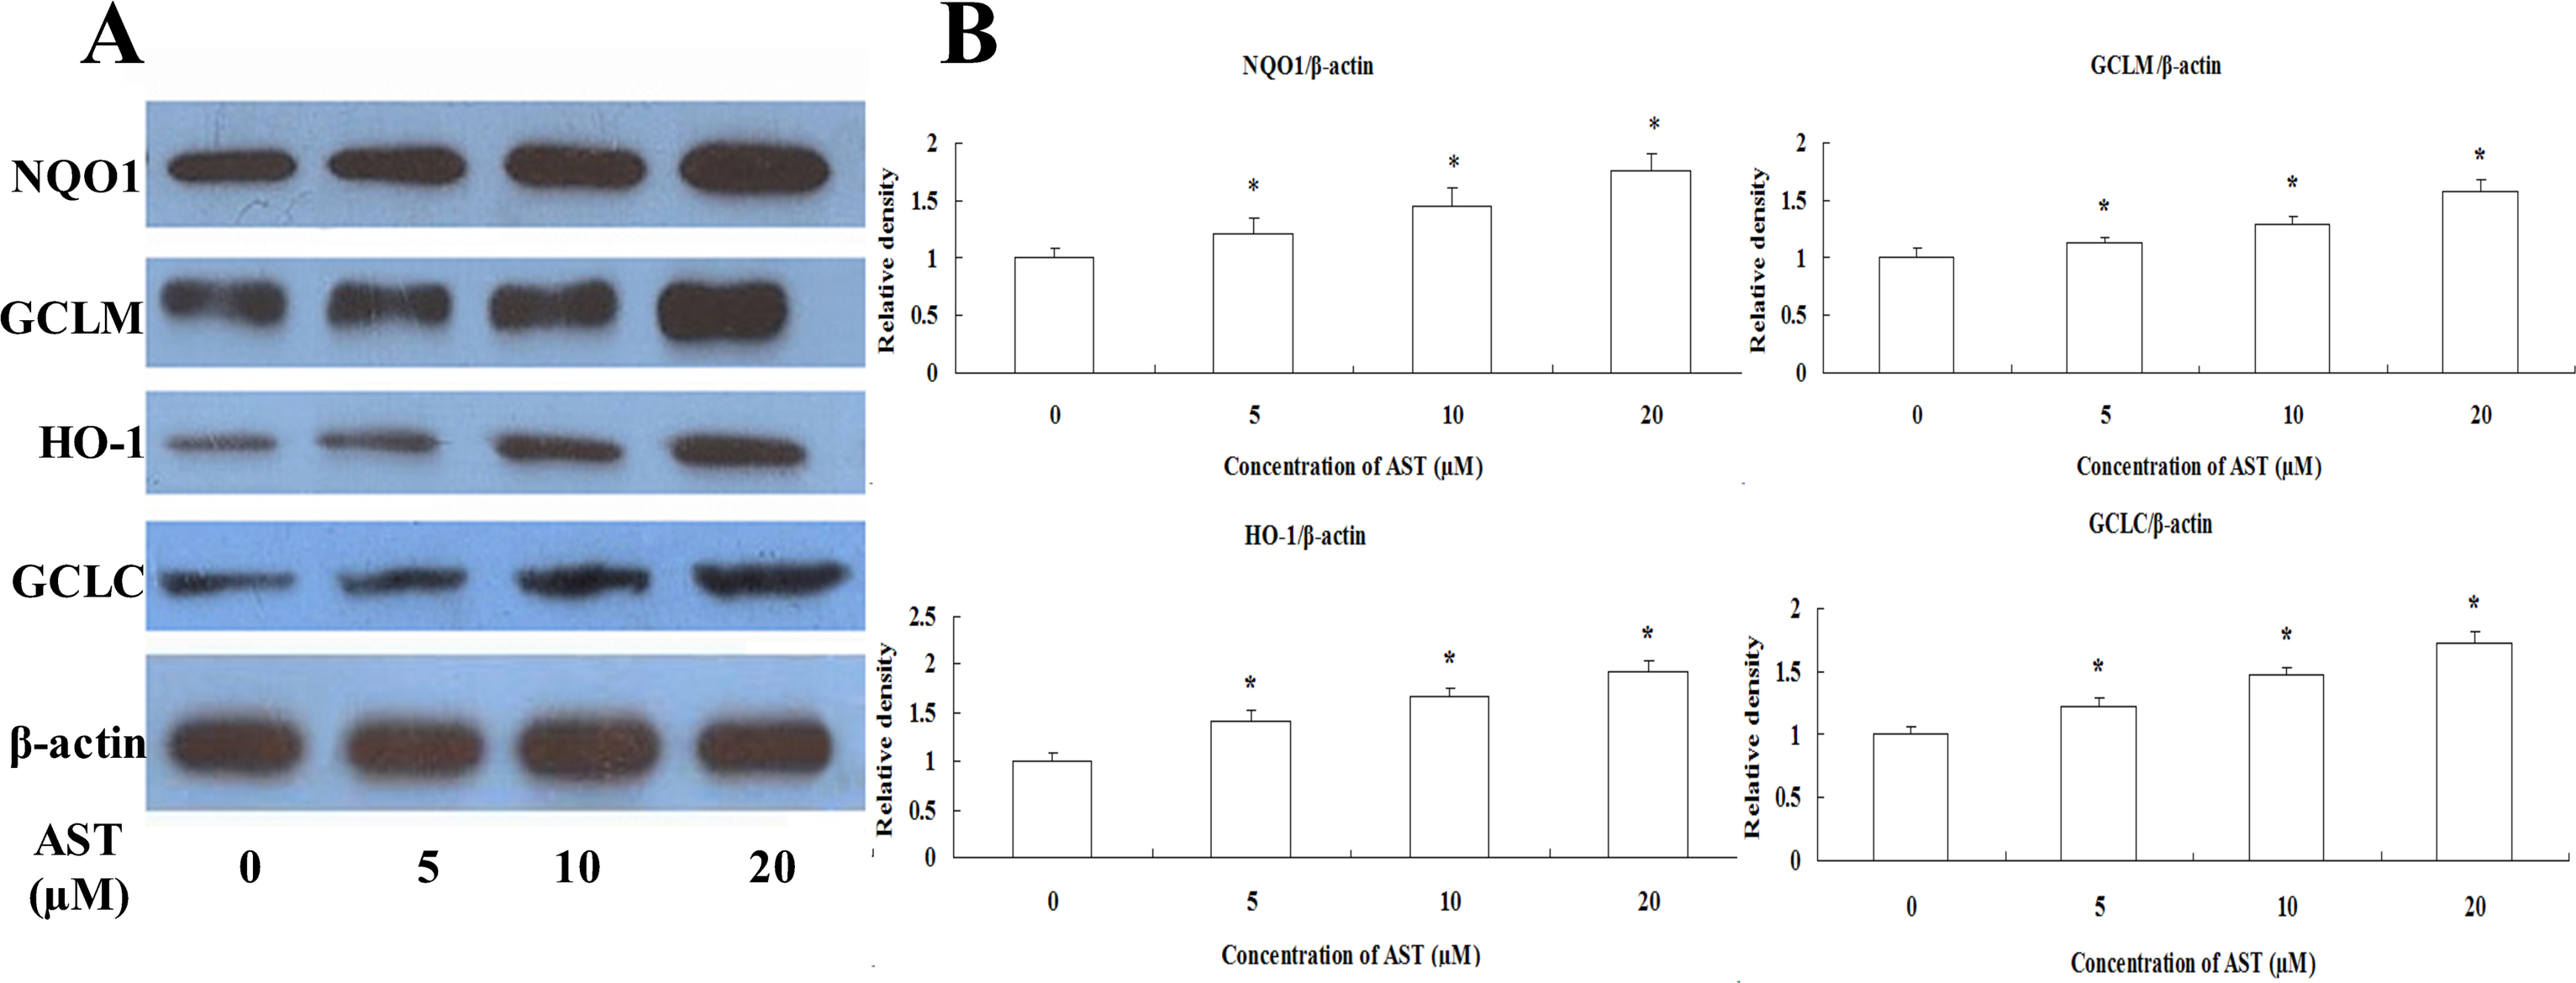
 Figure 6 of
Li, Mol Vis 2013; 19:1656-1666.
Figure 6 of
Li, Mol Vis 2013; 19:1656-1666.