Figure 6. Quantitative analysis of ankyrin repeat and suppressor of cytokine signaling box containing protein-10 colocalization and
coimmunoprecipitation. A, B: Pearson’s correlation coefficients were calculated using Imaris Bitplane software from compressed confocal z-stacks following
background correction. The square box tool was used to demarcate large ankyrin repeat and suppressor of cytokine signaling
(SOCS) box containing protein-10 (ASB10)-stained structures (B) and small vesicles (A). Error bars are the standard error of the mean. The number (n) of images analyzed for the small and large structures, respectively, was as follows: heat shock protein 70 (HSP70), n=3,
5; the α4 subunit of the 20S proteasome, n=2, 6; K63 ubiquitin, n=6, 6; K48 ubiquitin, n=7, 8; p62, n=9, 17; histone deacetylase
6 (HDAC6), n=3, 12; Rab7, n=3, 5; light chain 3 (LC3), n=10, 11; and lysosomal-associated membrane protein 1 (LAMP1), n=6,
3. C: Coimmunoprecipitation analysis of rASB10-green fluorescent protein (GFP) and GFP (control) was performed. Cell lysates were
coimmunoprecipitated (IP) with GFP or ASB10 antibodies, and then the western immunoblot (WB) was probed with ASB10, HSP70,
or the α4 subunit of the 20S proteasome antibodies. Lanes of the bound fractions are shown. The arrows point to the expected
size of HSP70 and the α4 subunit of 20S proteasome. Molecular weights are shown in kDa.
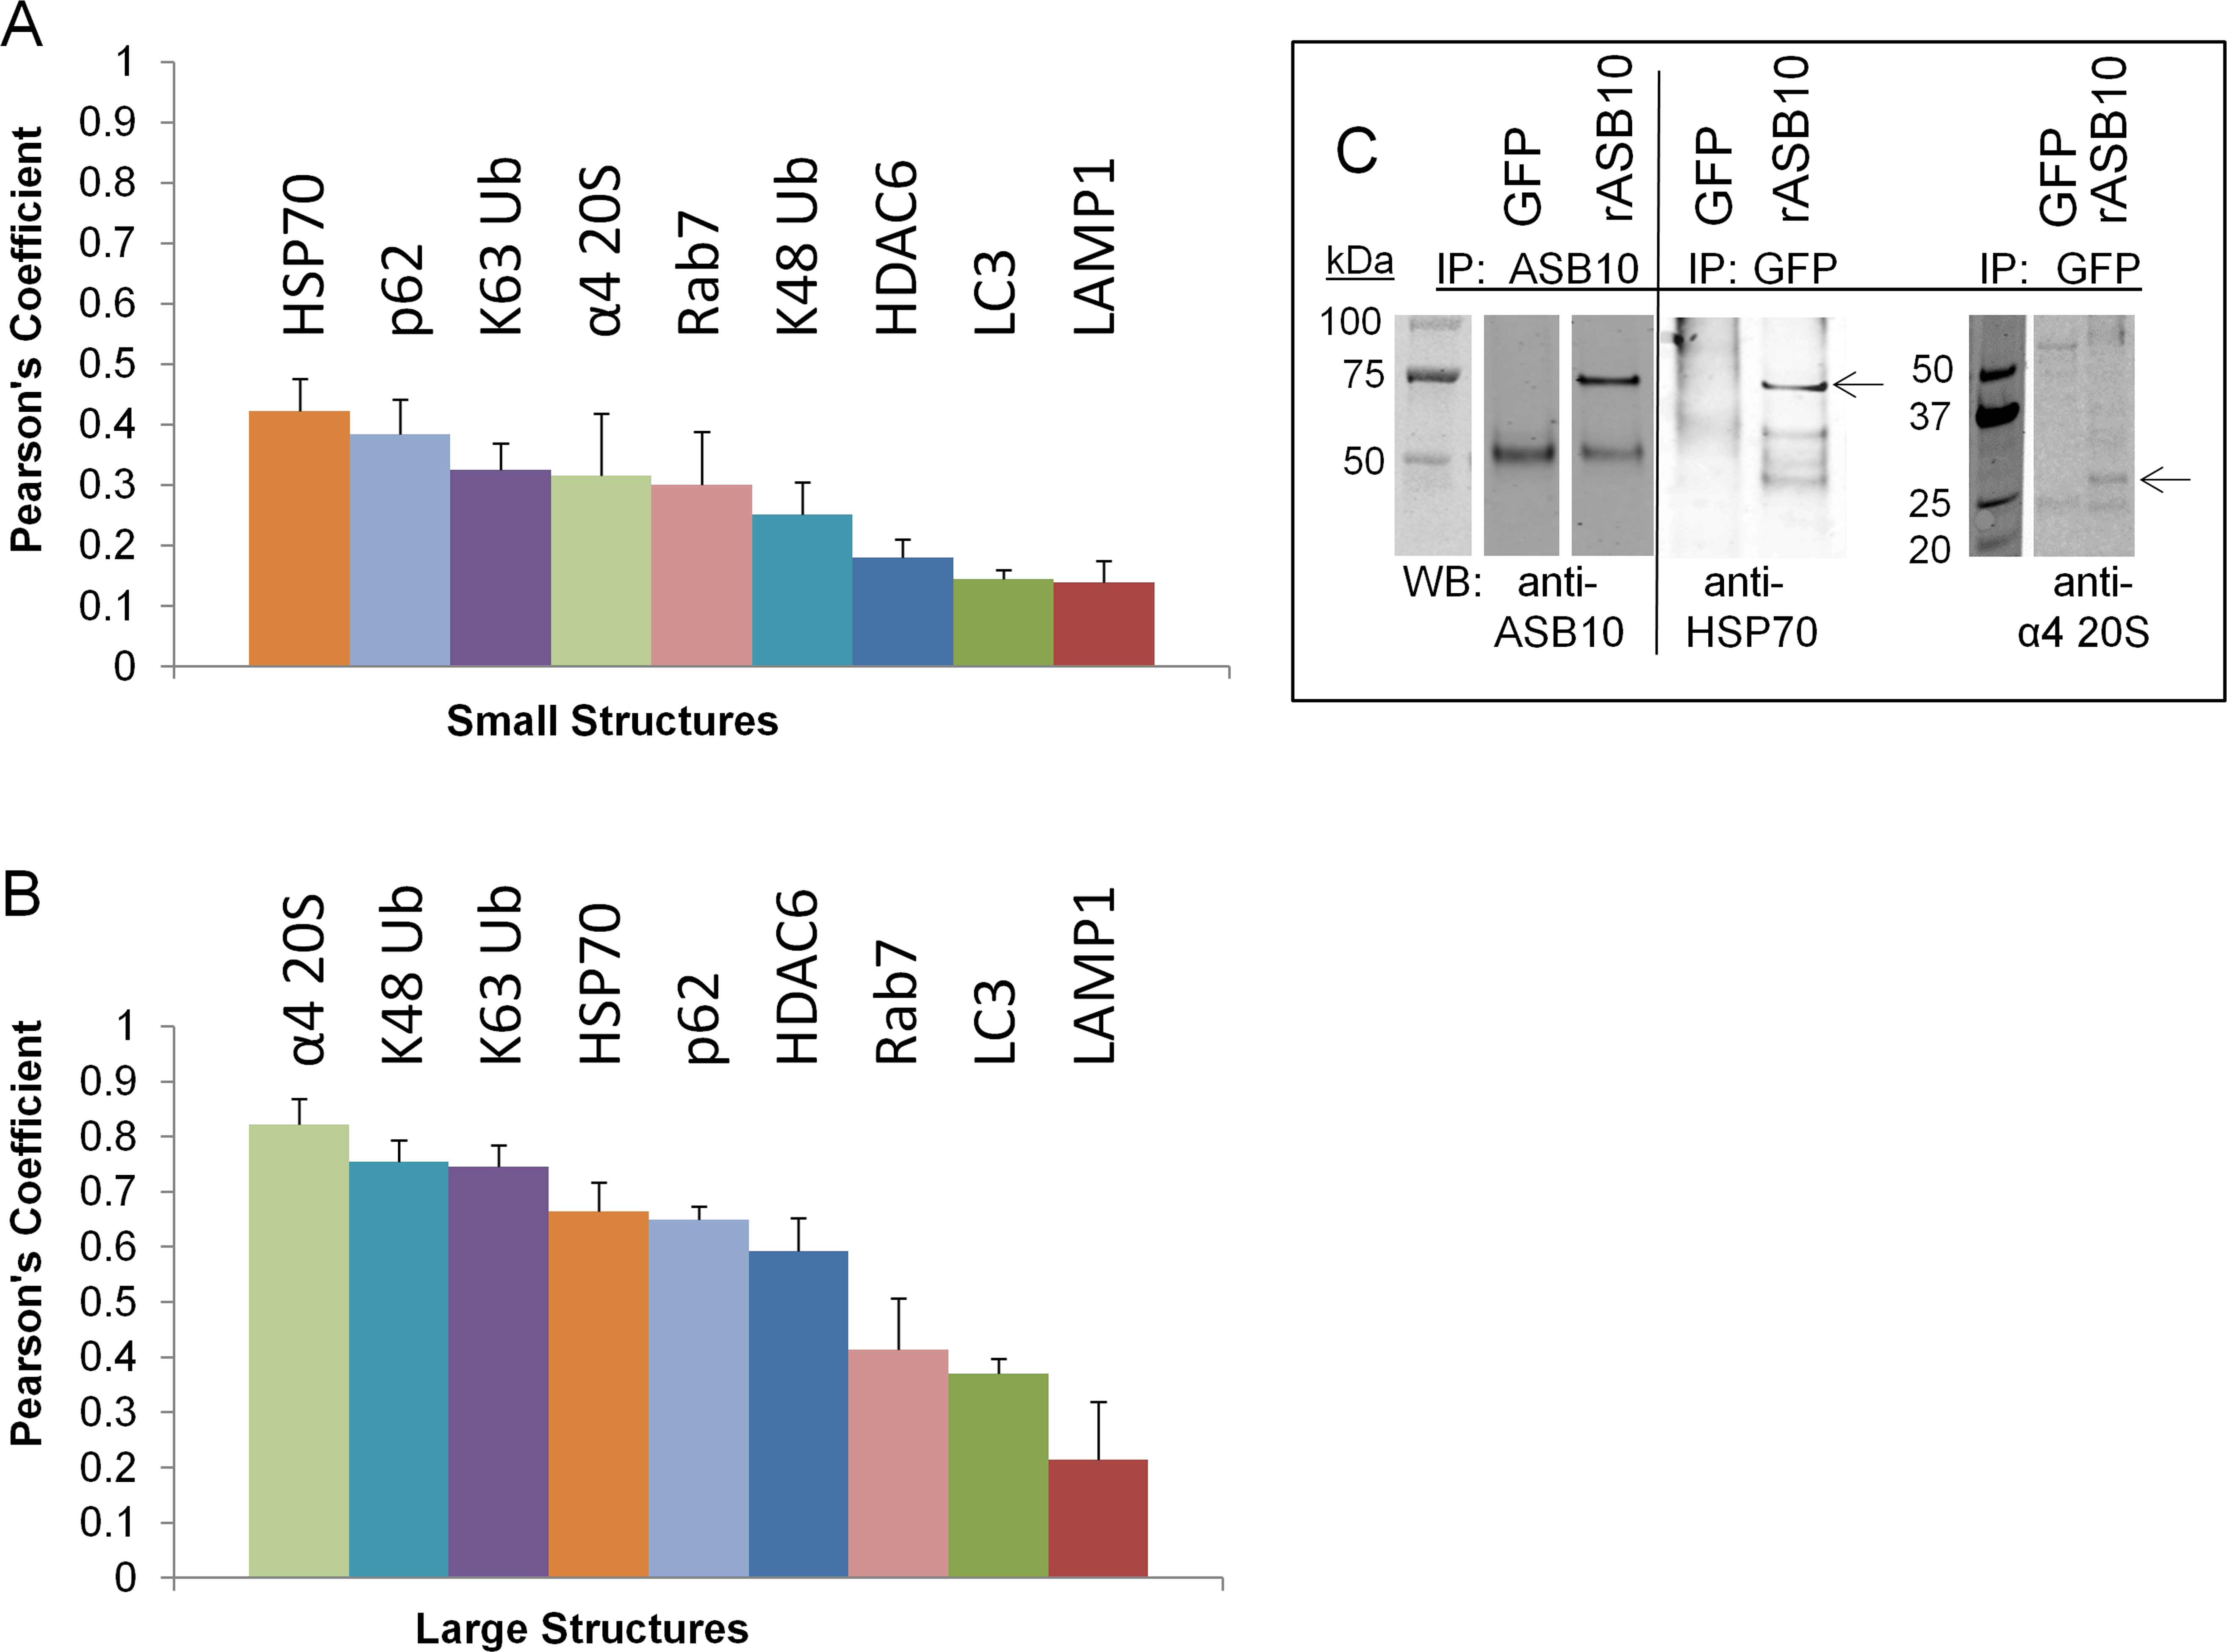
 Figure 6 of
Keller, Mol Vis 2013; 19:1639-1655.
Figure 6 of
Keller, Mol Vis 2013; 19:1639-1655.