Figure 4. Analysis of rhodopsin expression in rat retina exposed to low-intensity light. A: A western blot immunolabeled rhodopsin with a specific antibody showing the predicted isoform bands. The margin shows the
oligomerization states of the rhodopsin fragment (left) and the molecular mass (right). B: Quantitative analysis of the three oligomer band optical densities (o.d.) normalized to the content of rhodopsin from the
LD cycle controls. Data are mean ± SD (n=3 animals/group) from four independent experiments. Transformed data to log10 showed p=0.0001 by a one way-ANOVA. Duncan’s post-hoc test *: p<0.05, (LL7 and LL 10 D versus control in the LD cycle. The results are expressed as percentages.
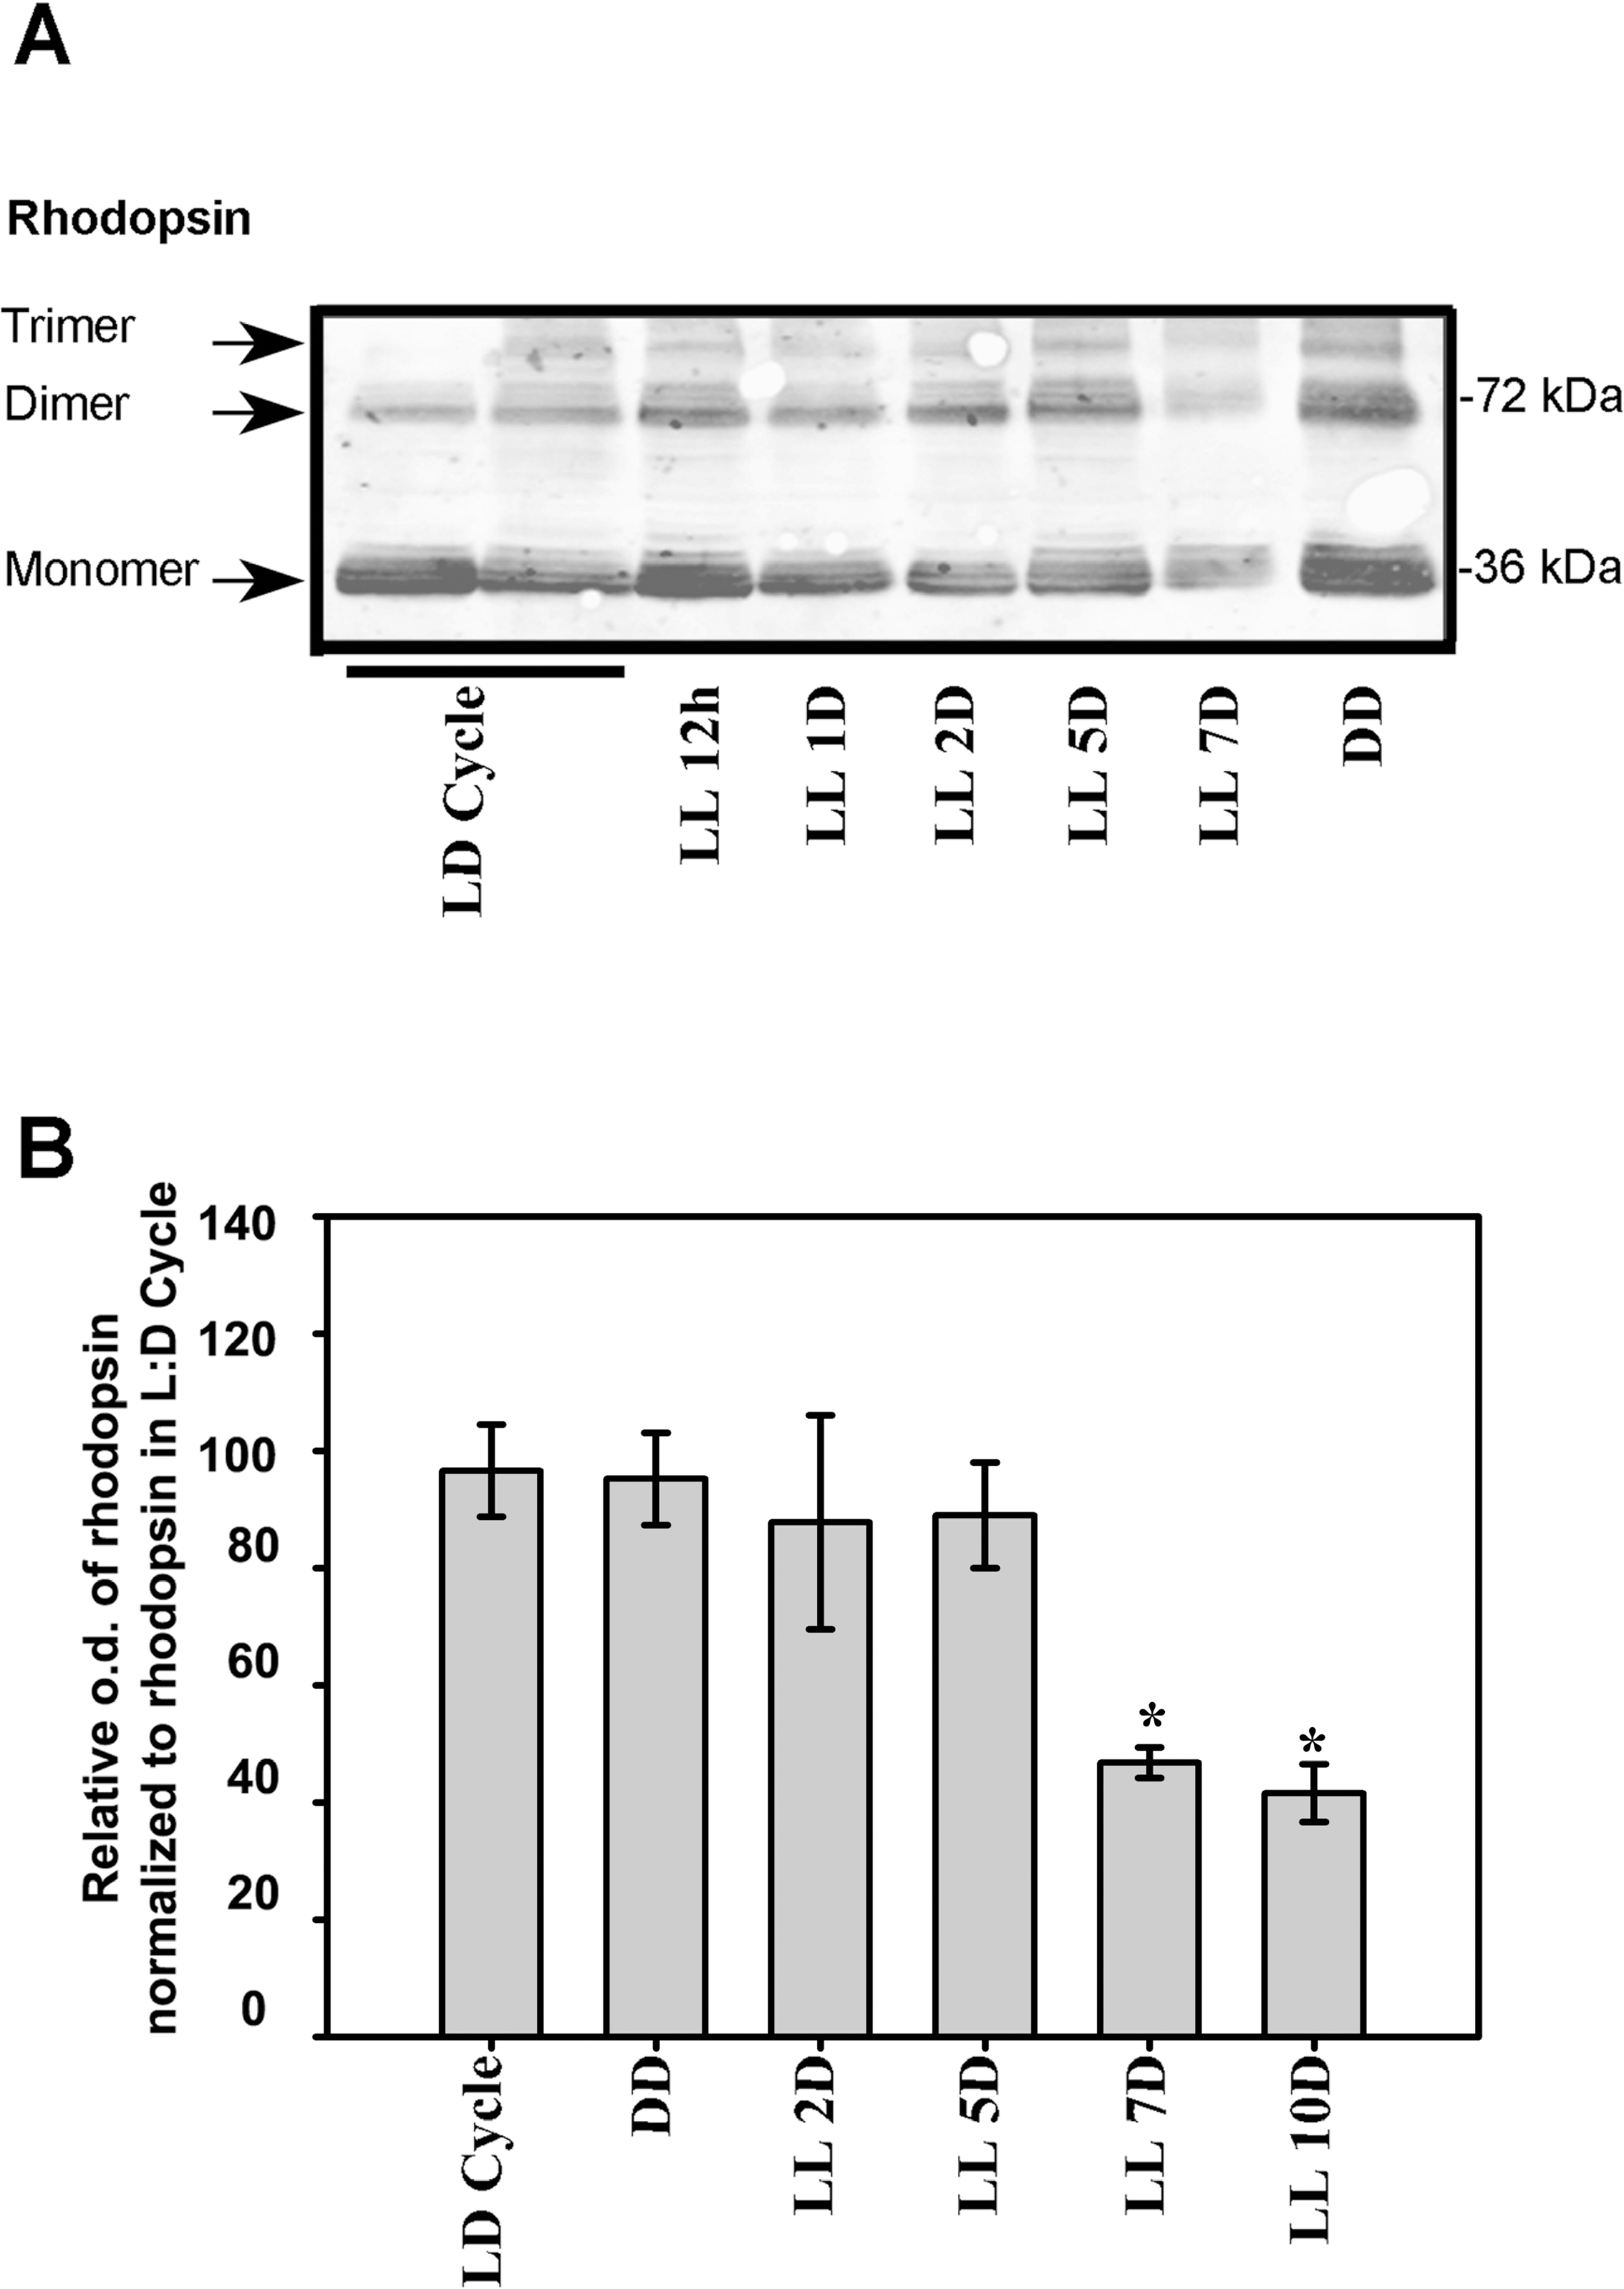
 Figure 4 of
Contín, Mol Vis 2013; 19:1614-1625.
Figure 4 of
Contín, Mol Vis 2013; 19:1614-1625.