Figure 2. Annexin V, PI and TUNEL assay in rat retina exposed to low-intensity light. A: Image showing a representative analysis of retina from rats exposed to a regular LD cycle 200 lx (L12h D12h) and for five
and seven days of constant light (LL). B: Quantitative analysis of flow cytometric detection, showing the mean of three independent experiments of retinal cells undergoing
cell death labeled with PI (quadrant 1), PI plus Annexin V (quadrant 2) and Annexin V (quadrant 4). Data are mean ± SD (n=3
animals/group) from three independent experiments. PI: p=0.012, by a one-way ANOVA. *: p<0.05 by Duncan’s post-hoc test (LL5D
and LL7D versus control in the LD Cycle). PI/Annexin: p=0.0153, by a one-way ANOVA. †: p<0.05 by Duncan’s post- hoc test (LL5
and LL 7D versus control in the LD cycle). Annexin: p=0.1455, by a one-way ANOVA. C-F: TUNEL staining (green) showing negative labeling in rat retina reared in LD cycle (C,D) and nucleosomal DNA fragmentation in retinas exposed to four days of constant light LL 4D (E,F). The images are representative of 3 different experiments per treatment. Blue: Propidium iodide total DNA labeling (C,E). Scale bar indicates 30 µm.
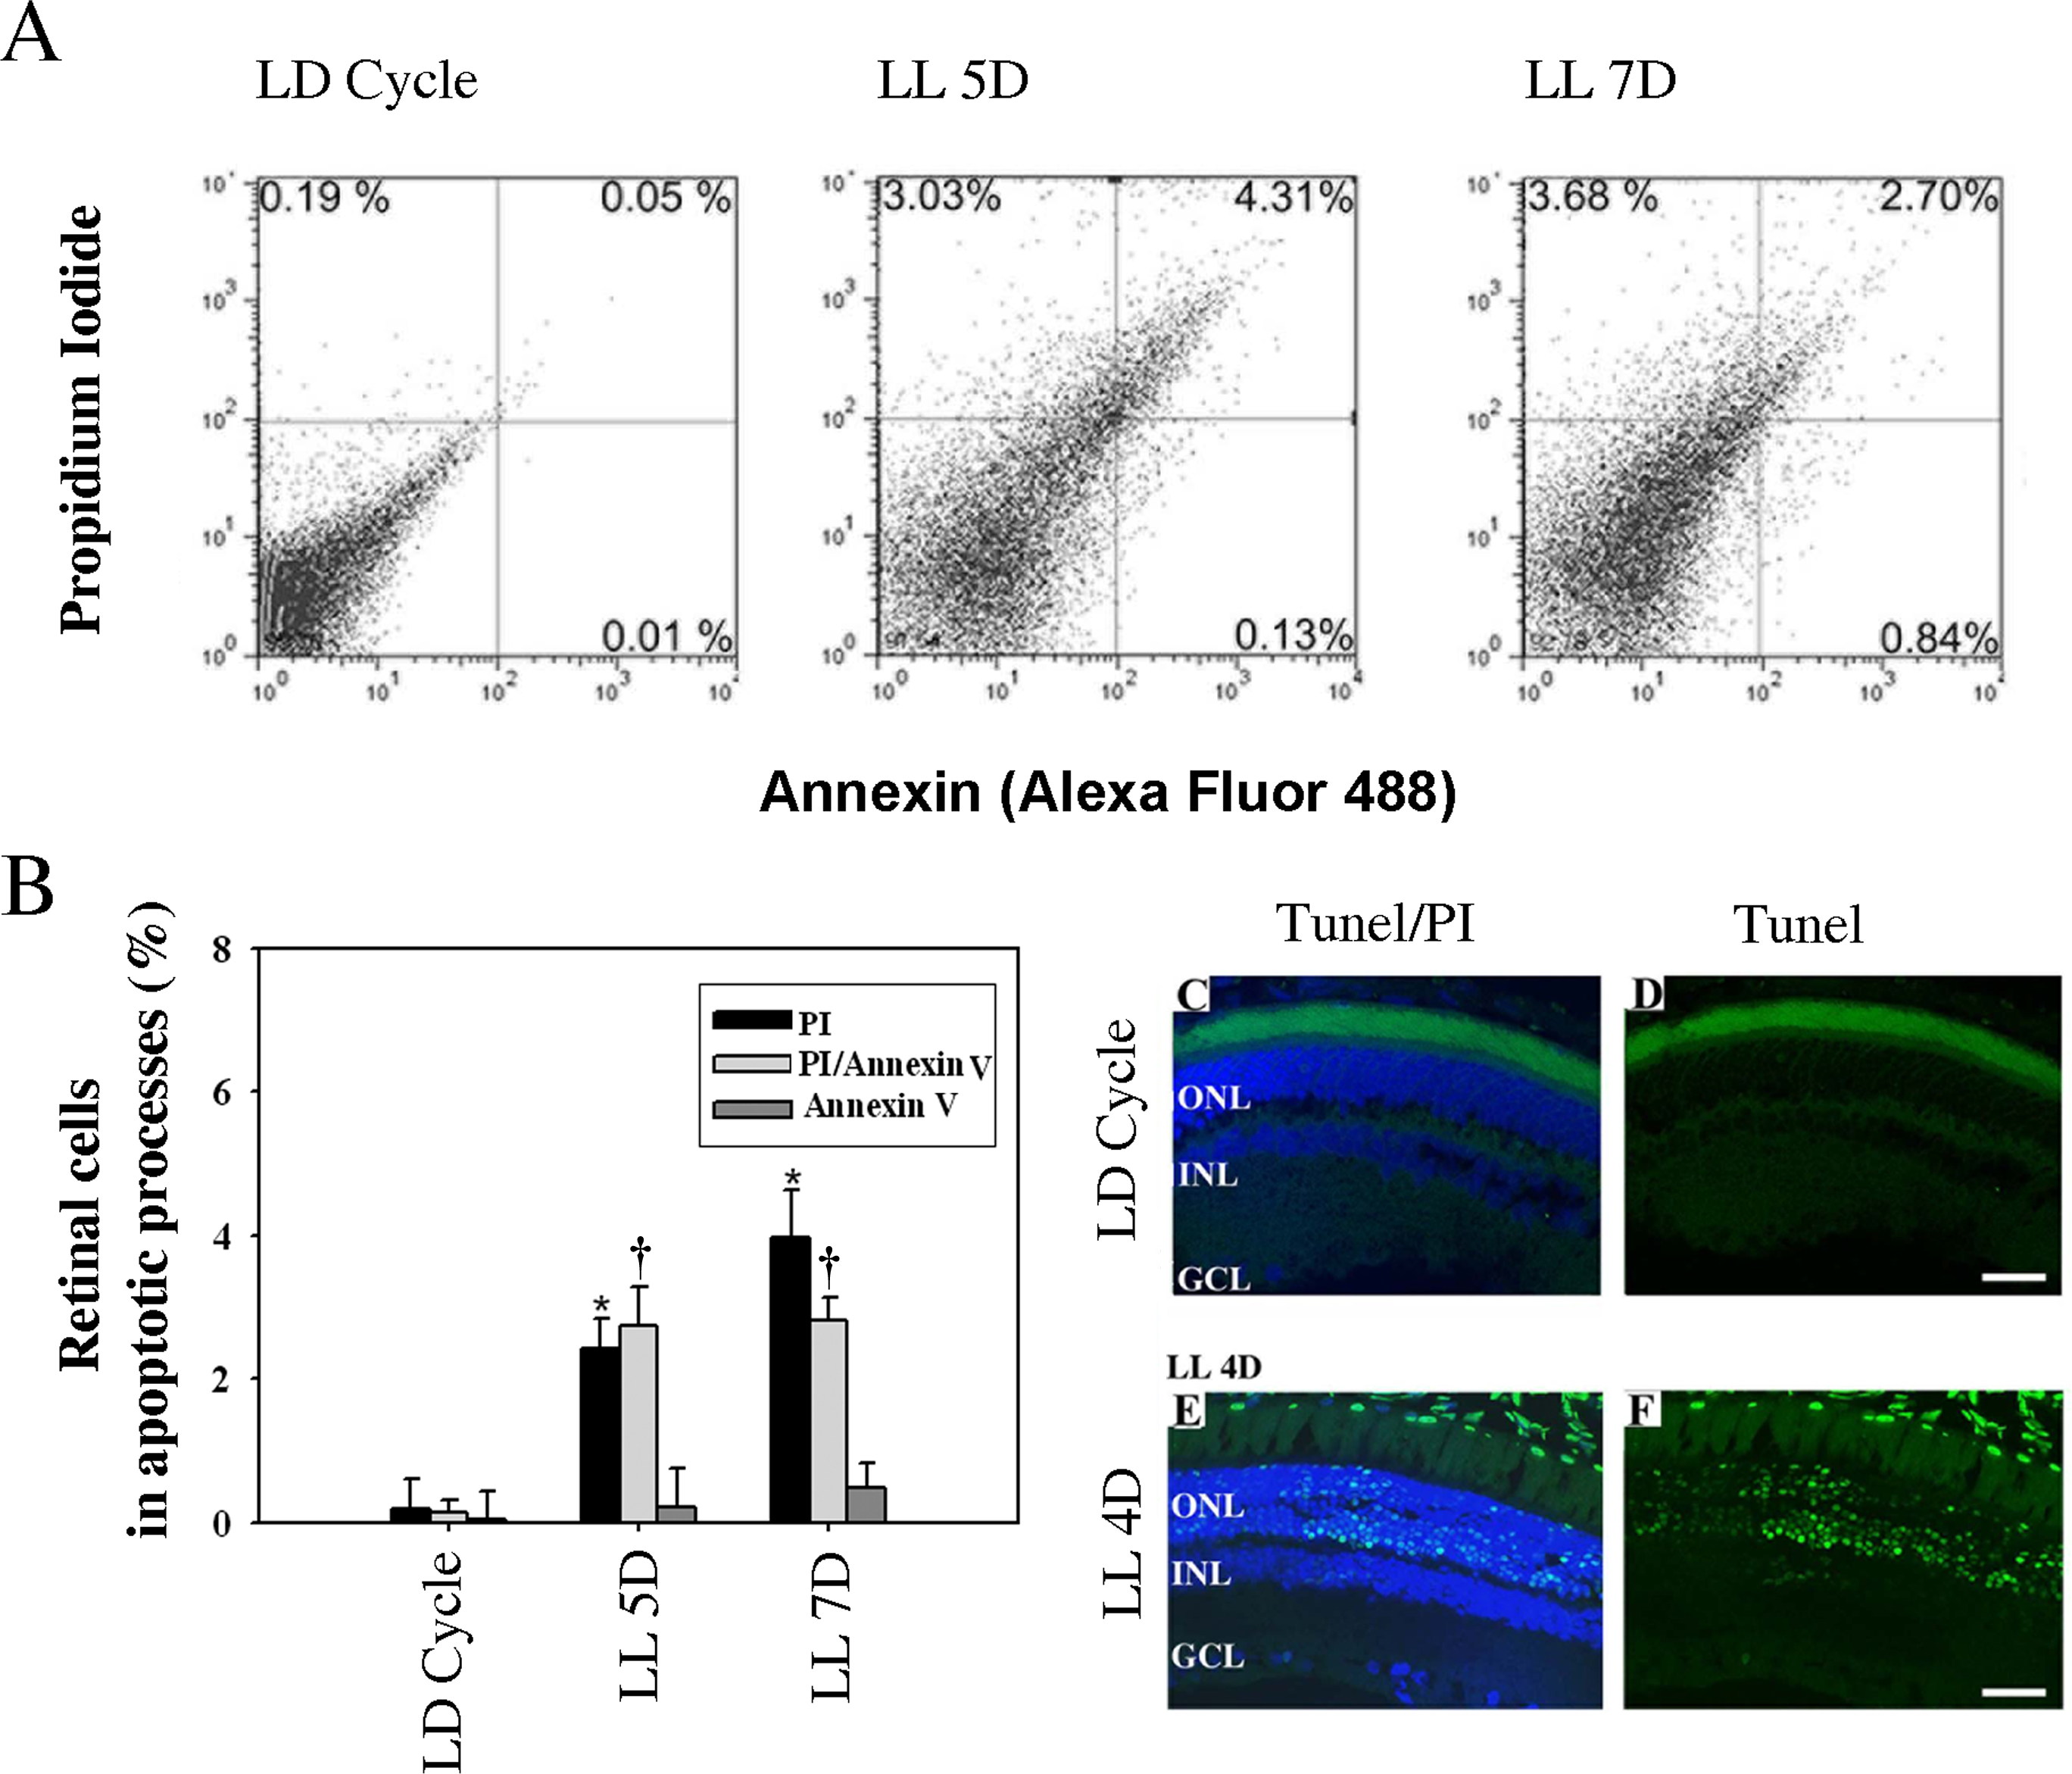
 Figure 2 of
Contín, Mol Vis 2013; 19:1614-1625.
Figure 2 of
Contín, Mol Vis 2013; 19:1614-1625.